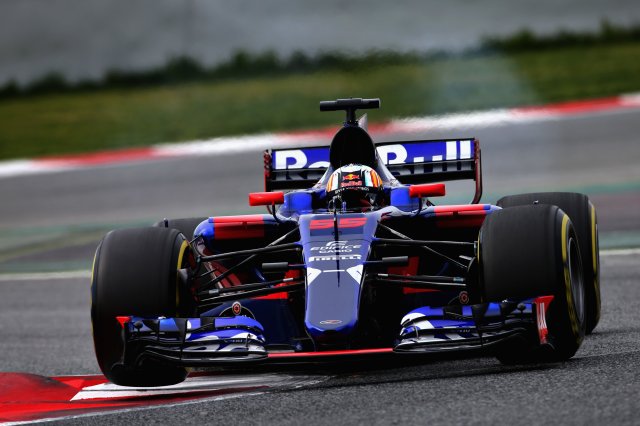
2017 marks one of the largest changes in the history of Formula 1. Not since 1966, when engine sizes were doubled, have the sport’s rule-makers introduced full-format changes with the primary intent of making the cars faster and more exciting. Instead, we have become accustomed to changes designed to curb speeds and improve safety, which led to the 2014-2016 breed looking somewhat prosaic in corners by the heady standards of the previous era. Even from the first days of testing, the 2017 cars have looked viscerally exciting compared to those that came before. There is a chance they will be the fastest circuit-racing cars ever created.
With that in mind, examining 2017 pre-season testing is a fascinating proposition. Not only do we want to quantify how much faster the cars have become, but also assess how Pirelli’s new harder tyres are performing, and see how the new rules have changed the team hierarchy, if at all. As I showed in a previous analysis of team dominance, major rule changes have a tendency to give a large advantage to one team, whereas static rules tend to close up the field over time. What is the form guide this year?
Reviewing 2016: The importance of long-run analysis
Before starting, it’s worth revisiting last year’s pre-season analysis to demonstrate the value of this data analysis approach. When it comes to testing data, media focus tends to be on the headline times, including the absolute fastest times set by each car. These alone, however, can be unreliable estimators, because times are affected by many factors, including tyre compounds, fuel loads, set-ups, engine modes, traffic, and how hard the driver is pushing. The difference between a fresh ultrasoft and a fresh medium compound tyre can be over 2 seconds, and the difference between a full fuel load and a qualifying fuel load can be over 3 seconds. Correcting for these factors is therefore critical for any meaningful comparison.
Making time corrections for tyre compounds is relatively easy, because they are visible. Fuel loads and other factors that teams may use to disguise lap-times are more difficult, because they are largely invisible. The best we can do with single lap-times is consider the length of the stint (i.e., how many laps the car kept running after setting its best time) as a lower bound on the amount of fuel the car was carrying. This was exactly the approach taken by Andrew Benson for the BBC analysis last year when he estimated the team hierarchy at the end of pre-season testing.
A superior approach is to consider performance on long runs, consisting of many consecutive laps. Besides incorporating more data, this approach potentially allows us to accurately fuel-correct the lap times. I showed a method for doing that last year, which involved “anchoring” fuel-loads for certain stints that were known to be from the teams running race simulations.
In the graph below, we can see how my estimates from long runs (red) and Andrew Benson’s BBC estimates from single laps (blue) compare to the actual average qualifying gap (green) across the first four races of 2016 (using best times set by each team). I chose the first four races, because the return to Europe usually corresponds to the first major car upgrades. Note that I wasn’t able to obtain enough long runs for Haas or Manor to make any estimates last year.
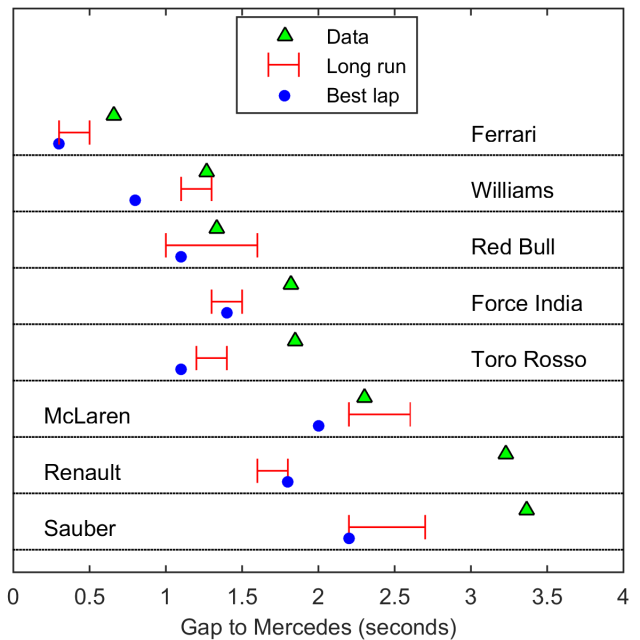
Neither method was perfect, because even when we are correcting for tyres and fuel, we may be missing other factors (e.g., engine modes), and some teams may have improved between pre-season testing and the races. Nonetheless, in almost all cases, the long run estimates came closer to the actual data than the best lap estimates. The one notable exception was Renault, where both estimates were far from the actual data. For unknown reasons, Renault looked considerably faster in pre-season testing than they did once the season started last year. Perhaps they were bluffing?
Fuel-correcting lap times in 2017
Moving to the 2017 pre-season data, we have almost no prior information. The tyres are completely new, meaning we know nothing about their wear characteristics or time steps between compounds. The cost of fuel per lap may be different from before, as may the team hierarchy, due to the huge rule changes. All of this will have to be figured out from the ground up.
The first step for analysis is finding a way to fuel correct the lap times. This requires estimating the cost of one lap of fuel on lap times. I was able to do this by looking at known race simulations (i.e., cases where teams ran multiple consecutive stints, with only tyre changes between them) where a driver ran the same tyre compound at two different fuel loads. Using race simulations by Hamilton, Ricciardo, and Verstappen, I was able to estimate an average lap-time cost of 0.054 seconds per extra lap of fuel at Barcelona.
Below, you can see a correction for fuel applied to each lap in Hamilton’s first and last stints of a race simulation, both conducted on soft compound tyres.

To correct the lap times, I have calculated what would be the equivalent lap time on a full tank of fuel for each lap. You can see that this does two things: (1) It brings the first and last stints into accordance with one another. (2) It increases the slope of each stint (by 0.054 seconds per lap). This is because we now seeing only the effects of tyre wear on lap times, without the usual compensating factor of decreasing fuel loads across the stint.
Datasets: 2010, 2016, and 2017
Once again, the star of testing for me was @f1debrief, who posted lap-times and tyre compounds for almost 100 long runs on Twitter. These formed the basis for most of my analysis. In addition, with some help from the F1 community, I was able to track down documents that contained ALL of the lap-times from one of the four-day tests at Barcelona in 2010 pre-season testing. This allowed me to compare the current Pirelli tyres to those in 2016 and the last year of Bridgestone tyres in 2010.
I cleaned unusually slow laps from long runs, as I did last year. Since tyre degradation is much more stable this year than last year, I set a maximum threshold of 1.0 seconds per lap deviation from laps on either side, down from 1.5 seconds last year.
Dynamics of the 2017 tyre compounds
In the last few years, Pirelli have made tyres that are designed to rapidly degrade. This was necessary to generate different pit-stop strategies, but some fans complained that drivers were consequently nursing their tyres too much during races. As I demonstrated last year, this necessitated extremely subtle tyre management skills to extract the best times across a long stint. In 2017, Pirelli seem to have demonstrated that they are equally capable of making very durable, high-performance Formula 1 tyres that respond almost linearly to wear.
Using known race simulations, I was able to fuel correct lap times on different Pirelli compounds for 2017, and to compare these to fuel-corrected lap times on 2016 Pirellis and 2010 Bridgestones. For this analysis, I tried to limit myself to as few top teams as possible: Ferrari and Red Bull stints in 2010, Ferrari and Mercedes stints in 2016, and Red Bull and Ferrari stints in 2017. In all cases, I corrected lap times to equivalent times on a full race fuel load.
For 2016 times, I found a similar fuel cost to 2017 of ~0.06 seconds per lap of fuel. Prior to 2014, however, F1 cars used about 60% more fuel, so the time cost of fuel per lap was considerably higher: around 0.09 seconds per lap of fuel at Barcelona. This value was used to correct the 2010 data, and it did a very good job of aligning race-simulation stints of known different fuel loads.
The Bridgestone 2010 compound was not recorded, but was most likely the soft compound for the stints I analyzed, given most of the long running on that day of the test employed softs.
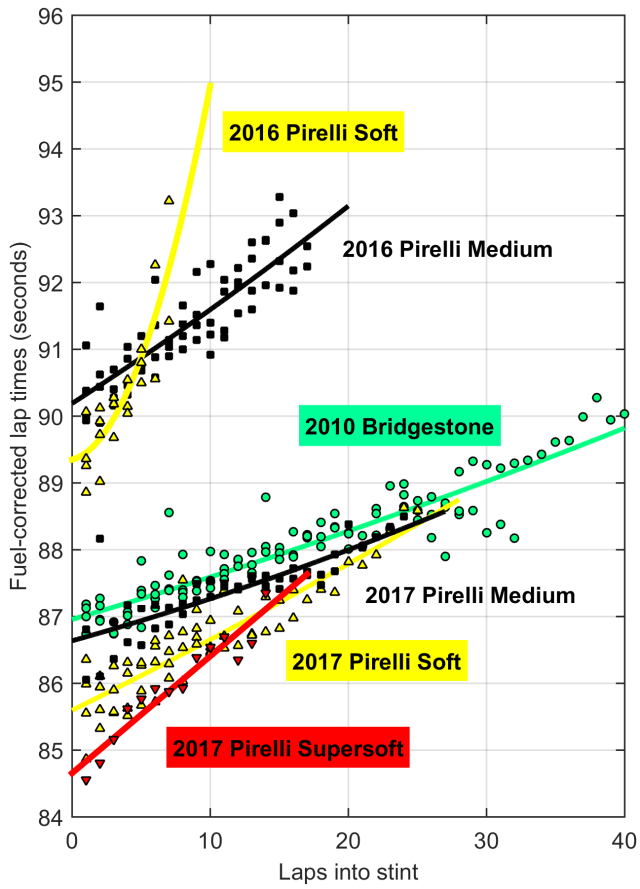
Overall, the 2017 cars are vastly quicker than the 2016 cars. In race stints, they are already averaging about 4-5 seconds per lap quicker. On full fuel loads, the 2017 cars are also already quicker than the 2010 cars, as shown in the graph above, where all times are corrected to full-race-fuel levels. On very low fuel loads, the 2010 cars will relatively gain about 2 seconds, due to the higher lap-time cost of fuel in 2010 than in 2017, so qualifying times could be similar, although the 2017 cars may have other weapons at their disposal over a single lap in the form of engine modes and previously stored energy.
The 2017 Pirellis are noticeably more durable than 2016 Pirellis. The 2017 medium compound actually behaves very much like the 2010 Bridgestone tyres, with an average degradation rate of just 0.07 seconds per lap when teams were running their race simulations in testing. The 2017 soft tyre seems to start roughly 1 second quicker than the 2017 medium tyre, and degrades slightly quicker, at 0.11 seconds per lap. The 2017 supersoft is faster again and degrades at 0.18 seconds per lap, making it slightly less durable than the 2016 medium, which degraded at 0.15 seconds per lap.
For race strategy in 2016, a key point was the crossover, where a fresh medium became quicker than a worn soft, or a fresh soft became quicker than a worn supersoft, as this allowed undercuts to occur. At most tracks in 2016, this point occurred around lap 5-15. As you can see from the graph above, a fresh medium at Spain on 2016 compounds was slightly quicker than a 6-lap old soft. In 2017, these crossover points still exist, but they occur later. A fresh medium is slightly quicker than a 14-lap old soft or a 12-lap old supersoft.
In addition, the 2017 compounds all seem to have a linear degradation profile. This behavior is fundamentally different from 2016 Pirellis, which tended to degrade rapidly and show nonlinear degradation when pushed for a long stint. This was particularly obvious on softer compounds, but visible even on mediums. For example, here are Red Bull’s medium stints from the 2016 Spanish Grand Prix, with the last race stint showing clear nonlinear degradation in the closing laps.
Strategic implications
One of the core reasons for high degradation tyres was the generation of pit-stops. Today, due to low pit speed limits, a pit-stop typically costs a net 20-28 seconds. Making up the cost of an extra pit-stop was quite feasible on the old Pirelli tyres, which typically lost 0.15 seconds or more per lap, meaning 2-stop strategies were the norm, and 3-stop or even 4-stop strategies were sometimes viable. With tyres that degrade less rapidly, it will be more challenging to make up the cost of a pit-stop. We therefore should expect fewer stops per race in 2017.
If we look back to 2010 as a guide — a year with harder tyres and no refueling — nearly every dry race was won with a one-stop strategy. Canada was a two-stop race, and such a welcome exception for fans that it was used as the blueprint for the design of the less predictable, higher degradation Pirelli tyres. We will probably see more two-stop races in 2017 than in 2010, because the difference in degradation rates between Bridgestone compounds tended to be small.
Using a race simulator, like the one I presented in a previous post, I computed optimal strategies for the 66-lap Spanish Grand Prix under different conditions (fuel cost per lap and time costs for a pit-stop). I did this for both the current regulations of no refueling, and with refueling allowed.
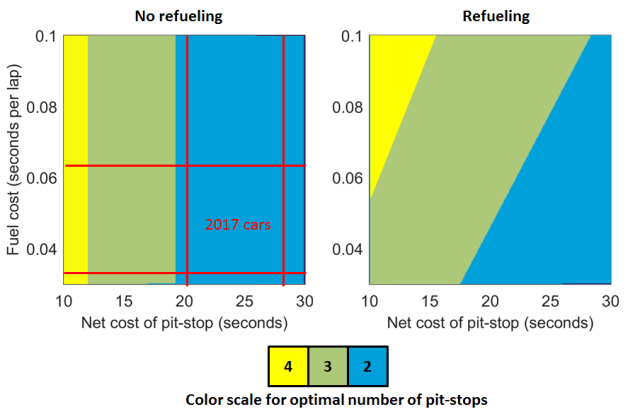
In the left panel, we can see that with no refueling, the 2017 tyres would tend to generate a 2-stop race in Spain, whereas last year we saw a mix of 2-stop and 3-stop races. Given Spain is one of the most punishing tracks for tyres, this suggests a year of mostly 1-2 stop races in 2017. Note that I did not include interactions with other cars in these simulations — these are the time optimal strategies for a car running in isolation, or able to easily overtake any other cars it encounters. If overtaking is particularly difficult, it can be optimal to stop fewer times to maintain track position, and/or to time pit-stops to gain track position on competitors.
The cost of fuel per lap has no influence on pit strategy when refueling is banned, but can have a big influence on optimal strategies if refueling is permitted. With the low fuel demands of the hybrid engines, fuel costs are relatively small, so refueling does not necessarily generate more pit-stops. With the thirstier V8 engines, the cost was around 0.09 seconds per lap of fuel in Spain, meaning a driver could gain almost 0.5 seconds per lap by running an average of 5 laps less of fuel. In that case, it could become a 3-stop race.
Some fans will no doubt complain if we see predictable strategies with few stops in 2017, as we did in 2010. What needs to be appreciated here is that we fundamentally cannot have highly robust tyres that encourage drivers to push AND races with many pit-stops, unless we also change some other variable. As we see above, the reintroduction of refueling does not actually help as much in the hybrid era, due to lower fuel usage and lower fuel costs on lap-time. Moreover, if we look at frequency of overtakes, we find they were consistently less common during the refueling era of 1994-2009.
A viable approach that I rarely see considered is decreasing the cost of a pit-stop. How would we achieve that? Increasing pit speed limits is unlikely to be considered acceptable for safety reasons. However, we should carefully consider the placement of pit-lanes. By placing them near slower sections of track (rather than main straights), and allowing the pit-lane to short-cut a section of track, we could potentially get the net cost of a pit-stop down to 10-15 seconds. As can be seen from the graphs above, this could generate more strategic variability.
Analysis of long runs
This year, establishing the team hierarchy from testing is extremely difficult. This is partly because I don’t have long-run data for as many teams as in 2016, and partly because performances considerably ramped up across the two tests, due to teams initially running very conservatively with the new cars. We therefore saw less of the cars running near their full potential.
Nevertheless, there are always some important insights to be gained from analyzing long runs.
1. Ferrari are currently quicker than Red Bull
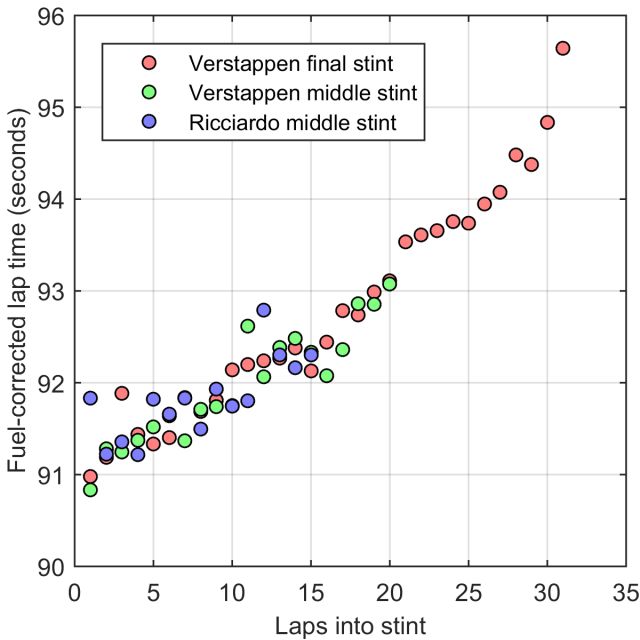
Ferrari and Red Bull both ran many long runs during the test. Importantly, from our perspective, they both ran full race simulations on days 6-8 of testing, allowing an almost direct comparison of performance. Below, I have plotted the fuel-corrected times for all stints set on soft and medium rubber from these race simulations.

Note that Vettel’s times at the end of his last stint look spurious. The sudden increase in times is not at all consistent with the dynamics of these tyres, suggesting a technical issue, traffic, the driver backing off, or some other factor. I therefore tested including vs. excluding these laps from the analysis below.
It’s visually obvious that Ferrari were consistently quicker than Red Bull throughout these stints after adjusting for fuel loads, to the tune of about 1 second. But to accurately quantify the difference in performance, we need to somehow also get a measure of how hard the drivers were pushing during these stints.
This would seem very difficult to estimate, but as I discovered last year, we can do it by fitting a line to the lap-times in each stint. As a hypothetical example, consider the two stints below.

When a driver is pushing hard, we tend to see lower base lap times, but also a steeper rise in lap times, indicating rapid tyre degradation. When a driver is being more conservative, we see higher base lap times, but then a more gradual loss of tyre performance. The optimal amount of pushing vs. conserving is then determined by the tyre compound and the length of the planned stint. By fitting lines to various stints, and doing my best to estimate and correct for fuel loads, I was able to derive a relationship between base lap times (the vertical intercept) and the rate of lap-time degradation (the slope) for the 2016 Pirelli medium tyre. This graph is reproduced below, with each point representing a single long-run stint.

In general, we see that higher degradation rates correspond to lower base lap times. This is when drivers are pushing harder. The precise shape of this curve will vary between tyre compounds, but the same basic principle applies: when the data are plotted this way, we expect to see a monotonically-decreasing curve if all the points have been accurately fuel corrected.
Applying the same method to the 2017 race simulations by Ferrari and Red Bull produces the following two graphs, one for medium compound tyres and the other for soft compound tyres. Each point on these graphs represents a single long-run stint.
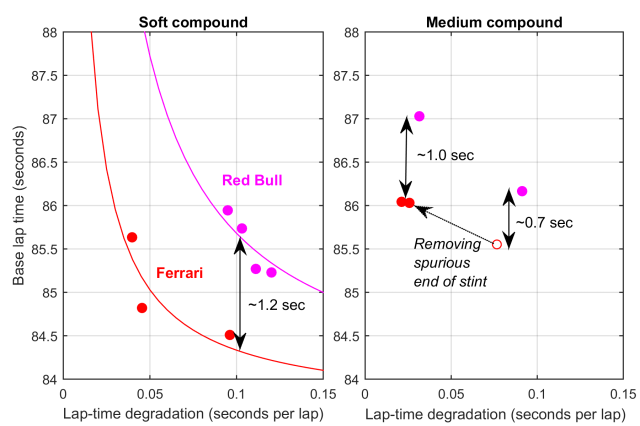
We can see from these graphs that Ferrari’s race simulation stints were generally run at very low degradation rates (i.e., not abusing the tyres). A few of the Ferrari stints were at very similar degradation rates to the Red Bull stints, and comparing those suggests an advantage of 0.7-1.2 seconds over Red Bull. This is a rather inauspicious start for Red Bull, given they were mooted as potential favorites for the 2017 season. We will see if Red Bull or Renault can claw back some of this deficit across the season, but at this point they do not look like realistic championship contenders.
2. The situation between Mercedes and Ferrari is totally unclear
Most analyses I have seen published to date have come out in favor of Ferrari, leading to considerable hype for their 2017 prospects. But on closer inspection I find significant flaws, which I think (without inside data from both teams) prevent us from reaching any firm conclusions on which team currently has the upper hand.
By analyzing the single fastest lap and sector times by each team, as he did last year, Andrew Benson for the BBC reports the following corrected times:
- Ferrari 1:19.0
- Mercedes 1:19.8
- Red Bull 1:19.8
- Williams 1:20.4
As I showed near the beginning of this article, this type of analysis has a wide range of error, due to inability to really correct for fuel loads and how hard the drivers were pushing. The gap from Ferrari to Red Bull is in the same ballpark as the gap derived from my long-run analysis above. However, the Ferrari to Mercedes gap of 8 tenths is, on the face of it, surprisingly large, as is the relatively small gap of 6 tenths from Mercedes to their engine-customers Williams.
An alternative analysis was presented by James Allen, comparing the fastest race simulations from testing between Ferrari, Mercedes, and Red Bull. The conclusion from this analysis is that Ferrari leads Mercedes by about 3 tenths and Red Bull by about 7 tenths. In principle, this is a better method of comparison, since it is using representative long runs set at presumably similar fuel loads.
However, there is a significant flaw in this analysis, which in my view invalidates it completely. Namely, the Mercedes race simulation is taken from day 3 of the first test, whereas the Red Bull and Ferrari race simulations are taken from days 7 and 8 (days 2 and 3 of the second test), respectively. A close examination of all the testing data suggests to me that all top teams were running more conservatively in the first test with their new cars than they were in the second test. The data are simply not comparable between those time points. To help illustrate the point, here is a graph of soft tyre stints for Ferrari and Mercedes.

The known race simulations are the solid circles. Comparing just these, we would indeed conclude that Ferrari looks better on long stints than Mercedes, by somewhere around 3-5 tenths. However, there are two other stints of unknown fuel loads with similar characteristics from day 2 of the first test, plotted as diamonds. Ferrari’s day 2 stint is clearly slower by a few tenths than their equivalent day 7 race simulation, whereas Mercedes actually look a bit quicker on their day 2 stint than on their day 3 race simulation. In other words, this is a murky comparison. Without a full race simulation from Mercedes in the second test, we are not comparing apples with apples.
Focusing on the second test
If we analyze just the long runs (at least 7 laps) from the second test for Ferrari and Mercedes, the following picture emerges. As before, each dot represents one long run.

In addition to the Ferrari race simulation stints with known fuel loads (the red dots we have seen before), there are stints with unknown fuel loads for both teams. The correct vertical position of these points depends on the true fuel load. I have therefore included a scale for each of these points. If they were in fact run on full tanks (~70 laps of fuel), they truly belong at the bottom of the scale. If they were in fact run on lower fuel levels, they should be adjusted upwards appropriately, with the length of the run putting a bound on the lowest amount of fuel the car could have contained.
On soft tyres, Mercedes ran three very similar stints of 8-16 laps. In each case, the driver was pushing quite hard, with low initial lap times and then a rapid degradation profile, most evident across laps 2-6. The three stints were very likely run on identical fuel loads, but how heavy? If it was 30 laps of fuel or more (allegedly the Mercedes standard in testing), these stints are probably faster than an equivalent Ferrari stint at high lap-time degradation, following the imaginary curve charted by their three race simulation points out to the right.
On medium tyres, Ferrari ran two high degradation stints of 8-9 laps, reminiscent of Mercedes’ fast runs on the soft tyres. These stints were quick, but likely at a low fuel load — perhaps only 10-20 laps — if they are to be reconciled with Ferrari’s pace on their race simulation stints. The difference in base times between a typical low degradation and high degradation stint after fuel correction is not more than 2 seconds, which would put an upper bound of about 30 laps of fuel for those two stints, given the base time of 86.0 seconds for the low degradation race simulations.
Mercedes ran one low degradation stint on mediums for 11 laps, similar to Ferrari’s race simulations. If this stint by Bottas was run at the same fuel load as Hamilton’s medium stint in his day 3 race simulation (~40-45 laps), then it is up to half a second quicker than the equivalent Ferrari race stints. But the truth is we don’t know — it might also have been run with 20 laps of fuel, in which case Ferrari look half a second quicker.
What should really raise our attention is that incredibly fast, low-degradation stint from Mercedes on the medium compound. Here are the raw lap-times from that stint, which was run by Bottas.
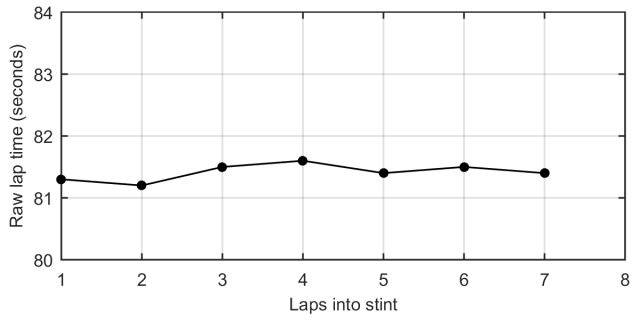
This is a shockingly stable stint, with no sign of the tyres taking serious punishment, suggesting the driver is still some way from the ragged edge of performance. Even if we assume the car was carrying only 7 laps of fuel, the fuel-adjusted time for this stint is seriously impressive: a base time of 84.7 seconds and a degradation rate of 0.08 seconds/lap. Contrast this to the Ferrari race stints with a base time of 86.0 seconds and a degradation rate of 0.02 seconds/lap. Clearly there is a lot of performance left on the table by Ferrari there, given the almost negligible degradation rate, but could they trim 1.3 seconds while keeping a degradation rate as low as 0.08 seconds/lap? I am somewhat doubtful. This stint is in some ways the most impressive thing I saw from this test, and enough for me to stop short of making any firm conclusions on Ferrari vs. Mercedes.
The nearest I saw from Ferrari was a 14-lap stint run by Vettel that was reported on the live trackers as being very stable and very fast in the 81-82 second range. By combining data across live trackers, I was able to approximately reconstruct the first 11 laps of this stint. If we assume that the 7-lap Mercedes stint above was run on about 7 laps of fuel, and the 14-lap Ferrari stint was run on about 14 laps of fuel, then these are the fuel-corrected times.

These stints are very similar to the hypothetical examples I plotted above for a driver conserving vs. a driver pushing hard. Vettel’s stint starts faster (base time of 84.3 sec of 84.7 seconds) but also falls away more quickly (0.17 sec/lap vs. 0.08 sec/lap). If Bottas pushed a bit harder, would we see something closer to Vettel’s line? Or something even faster?
We will simply need to wait for the first few races to tell who has the upper hand here. As a fan, that’s a genuinely exciting position to hold at the end of testing.
And on that note, I wish you all a very entertaining season!

best preseason analysis EVER
Thanks for this great post! I was really looking forward to an analysis of the preseason testing. Based on the fastest laps, Ferrari seemed stronger on most compounds, but of course there are too many unknowns to draw definitive conclusions. Still I’m a bit confused why Mercedes are so much faster in this analysis. Did they run higher fuel loads in their qualifying runs?
By the way, the analysis suggests there is still quite some tire degradation and that drivers still have to manage the tires. However, tire wear may be lower in the actual race weekend, possibly due to better car setups or because the higher temperatures suit the tires better. According to an analysis of the 2016 race, tire degradation was 0.10 seconds per lap on mediums and 0.22 seconds per lap on softs (http://f1infigures.blogspot.nl/2016/05/spain-race-analysis.html), which is less than the 0.15 seconds per lap on mediums in last year’s preseason test. If this also applies to this year’s race, it may be much more like a 2010-style race.
I don’t think that shorter pitstops will create more interesting races. In the early days of the Pirelli era races were interesting mainly because of huge differences in tire grip caused by high tire degradation. Relatively long pitstops ensure that drivers who pit early lose many places, so after the stop they had to fight much slower cars on much worse tires. With less degradation and shorter stops I don’t think that mixing mechanism will be as effective as before. I agree that strategic variation is indeed desirable, but I don’t think it depends much on the average number of stops. What is needed is just the right amount of tire degradation, so that drivers are indifferent between two and three or one and two stops (which will more likely be the case this year). In case of very little tire degradation, it may be a good idea to scrap the mandatory tire change rule, so some cars may try to finish the race without stopping.
Really great analysis! Quick question regarding the pit stop analysis, what are the probabilities for 1-stop strategies in 2017?
Not sure how to quantify the probability, but I think it’s likely we’ll see some one-stop races, especially where it’s hard to overtake or there is lower tyre wear.
Thank you. I read on different sources that Pirelli tires will degrade less this year, and that it would result in more 1-stop races.
Interesting data.
6 questions.
1. How do you know for certain when a team uses fresh tyres or used tyres?
2. How do you know for certain that some of those stints were not done with aero rakes?
3. How does track temperature and tire temperature affect degradation.
4. Is there any chance someone made a mistake in posting those stint times?
5. How does your model take into consideration the rubber on the track and how it affects traction?
—
Now looking at the data and at the low-degradation stint from Mercedes on the medium compound. I have another question.
1. Who did that stint, Hamilton or Bottas?
—
I will be expecting your answers.
1. I don’t, but the pace would be much slower on a significantly worn set.
2. I don’t, that’s another variable. But that wouldn’t be done during race simulations.
3. There will be some effect, but I have never been able to quantify this. Probably impossible to do from the data I have, because there are already so many other variables in play.
4. Sure. But the race simulations I cross checked with other sites (e.g., James Allen).
5. It clearly doesn’t.
6. Bottas.
One obvious rule change that could help create interesting strategies is to do away entirely with the mandatory pitstop to change to a predetermined tire. You might then see the likes of Perez trying to make it the full race distance on the set he started on, or teams going for three stints on ultrasofts vs two stints on softs, etc. Also, it’s really not a good thing for everyone to know that so-and-so will have to do a pitstop because he has to change onto this or that tire by regulation. This rule was introduced in an effort to mandate interesting strategies, but like every other rule introduced in this increasingly ill-conceived and overregulated era of F1, it achieved the exact opposite of what was intended.
Basically give everyone more freedom, and you’ll have more unpredictability, which is the essence of good racing.
[…] 2017 preseason analysis (F1 Metrics) […]
Nice read – thank you very much for putting in the hours compiling and plotting this data for us to look at.
Question: What do you use to make your graphs?
Thank you! I use Matlab for both the analysis and graphics.
Excellent analysis from the information at hand. Have been waiting for this since the last day of testing, keep up the great work.
Have always found it interesting what the motivation has been to keep changing the rules, adding DRS and messing with high-deg tyres came after a period of very exciting racing where at least 2 teams were competing for top honours (2005-2010)?
Thanks for this! A quick question:
It is always assumed that lap time due to fuel is a linear relationship. Why is this? Have there ever been cases where this is not true? It seems logical to me that getting rid of X amount of weight would have a larger affect on a lighter car.
So, in reality, it will indeed be a nonlinear function, but within the range of weights and set-ups typically seen a linear approximation works well.
Correct. Fuel load performance hit is exponential. That is why making large rockets is hard: you need a lot of fuel, and then more fuel to be able to lift that fuel you added.
Basically, the more fuel you add to a vehicle, the more weight you also add, which requires additional fuel.
For example, if a car with no fuel needs 1kg per lap, and you want to complete 100 laps, you might think you can load 100kg and reach your goal. But now the car would be heavier, and it would use more than 1kg per lap. Thus, you will need more than 100kg of fuel to complete 100 laps.
I may be wrong, but I don’t think fuel weight affects a rocket in the same way as a F1 car. A rocket needs to conquer gravity, so then additional weight will weight immediately require more fuel. F1 cars are different. Acceleration and deceleration are to a certain extent grip limited, so then weight has a minor effect on the car’s performance. Weight also doesn’t affect the car’s top speed too much, but reduces medium-speed acceleration. Weight mostly affects cornering speeds, especially in high-speed corners that are not flat-out. Theory suggests that fuel weight is “felt” more at lower fuel loads, but given that the fuel load is relatively minor compared to the car’s weight (at most 105 kg versus 730 kg), this effect should be small. Weight may increase fuel consumption, as more mass has to be accelerated. However, as most energy is used to overcome air resistance, the effect may not be very large. Also the cornering speeds are lower, which requires the driver to lift more, thereby reducing fuel consumption.
Interesting analysis, which program did you use? In case this was R, can you share the code/script. Many thanks
Thanks! All Matlab in this case.
Hello! Where is WIlliams from your analysis?
[…] Lots of cool data & analysis from the 2017 pre-season testing on F1 Metrics. […]
Thank you for putting time and effort to compile and present this analysis.
Regarding the last graph (7 vs 14 lap stint):
1. Assuming fuel loads are as suggested Vettel’s car would’ve been heavier than Bottas’ for first half of the stint (7 laps) making his (Vettel’s) times even more impressive
2. Have this runs been recorded at the same track and air temperature
Also, we have seen last year how important pole position is and there is strong indication that overtaking will be just as difficult (if not more) this year. Looking at the single fastest lap and sector times by each team (via Andrew Benson) clearly there is some performance left on the table by Mercedes there, given their traditional showing in pre-season testing, but could they trim 0.8+ seconds and assume meanwhile that Ferrari has been running their own engine “to the max” (single unit for both weeks)?
Regarding 1, times plotted there are already fuel corrected.
Regarding 2, no. The weather was fairly stable throughout the test, but I don’t have those data.
Historically, Ferrari have been closer to their maximum performance in testing than Mercedes, so I’m still very agnostic on this one. If you look at only best sector times, Williams are quite close to Mercedes. That alone suggests to me that Mercedes can go considerably faster than the pace shown on single laps.
1. Thank you for clarifying that.
Historically Ferrari never gets it right 1st year of major regulation changes either yet they are already “in conversation” this time around. Their public conduct is considerably different this year comparing to last year.
That coupled with Vettel lifting off and Kimi’s interview (we could’ve went faster) suggests to me Ferrari as well can go considerably faster than the pace shown on their best single lap.
Awesome analysis !!!
I also like your proposal about shorter pit times.
Another possible change is to have 3 mandatory pitstops with the use of all 3 different compounds.
It woukd create a situation of racing instead of covering other cars. It would be impossible to cover all other cars with different strategies so it would entice the drivers to push at all times during the race.
It would be a diversity of strategies available.
Pit early, put on quick rubber and overtake and gain positions, the leaders would be forced to charge too and not lap artificially slow.
More racing and less covering the others.
Judging by your analysis, sector times from australia and onboard clips, it seems that Ferrari has an advantage under braking while Mercedes has an advantage in the straight and high speed corners.
Vettel is able to brake later and fight oversteer as the car starts accelerating, a style of driving that might seem as on the limit, while Lewis brakes earlier, throws the car in the corner and accelerates earlier than Vettel.
This difference i suspect is due to rake and wheelbase, that being said I think that Mercedes will dominate circuits like Monza and Spa, while I Ferrari will be strong at Suzuka and Monaco.
Let us not forget the fact that Vettel worked with Red Bull, the same Red Bull who developed the last 3 championship winning cars with roll oversteer just as Vettel likes it and this years Ferrari is the confirmation that the SF70H is tailored to Vettel’s preference.
I have a simple suggestion regarding this blog, i think it would be nice to see an analysis of the pecking order of the first half of the season posted in the summer break.
Just an analysis of the performance of the cars up until that point, but not the drivers.
Thank you, kind sir!
[…] pundits and analysts were tipping Ferrari as the preseason favorites, I wasn’t as convinced. By my numbers, preseason testing was just too close to call; and so it played out as the early season evolved. […]
[…] from the headline times. In 2016, I accurately predicted the gaps between the main competitors. In 2017, I focused on the top 3 teams (due to data availability) and accurately predicted that it would be […]