With testing finished, I continued my earlier analysis to form a clearer picture of the team hierarchy as we go to Melbourne. This time I have taken both tyre degradation and fuel loads into account. Making predictions in F1 is extremely difficult, as I found out in a previous analysis of F1 economics. Nevertheless, I think there are significant insights to be gained from a rigorous analysis of the preseason testing data, some of which I have not seen presented elsewhere.
Thanks once again to @f1debrief, who was kind enough to post data for a total of 103 stints. This is not the entirety of lap-time data from testing, but it is far and away the best data-set anyone made available to the public.
Since the great majority of long runs were completed on the medium compound (83 of the posted 103 stints), I used these for my analysis below. For a few teams that were underrepresented in the posted 103 stints, I compiled an additional 7 medium stints from other sources.
As in my earlier analysis, I cleaned the data by excluding laps that were much slower than those surrounding them. I refined this cleaning method by including two rules: (i) if a lap was 1.5-3.0 seconds slower than laps either side of it, the lap time was treated as missing data; (ii) if a lap was >3.0 seconds slower than laps either side of it, the lap was excised from the stint, stitching together the parts of the stint on either side. I took this approach because extremely slow laps will not contribute much tyre degradation, and so can probably be ignored altogether.
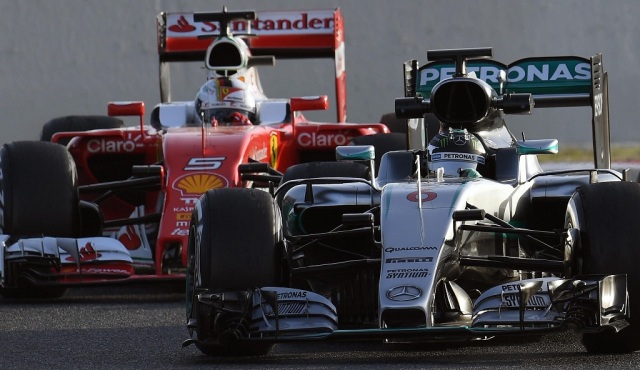
Mercedes
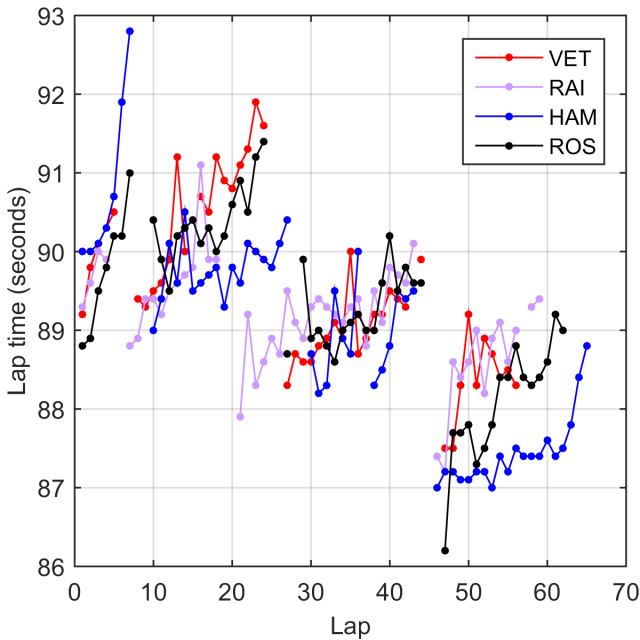
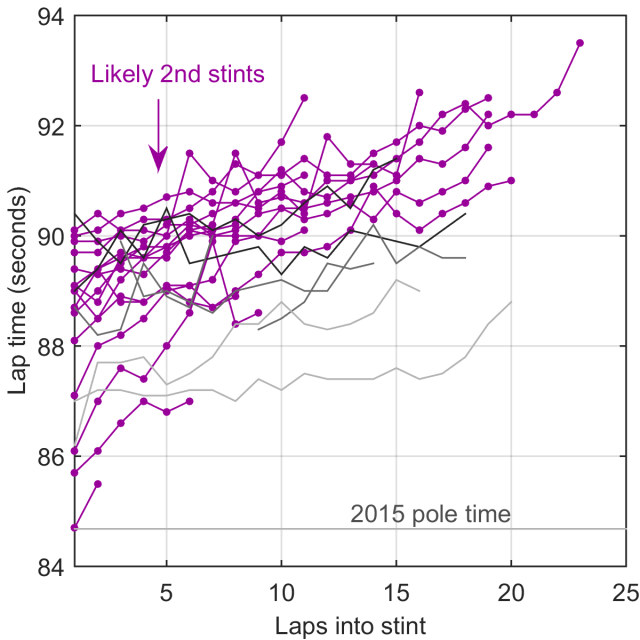
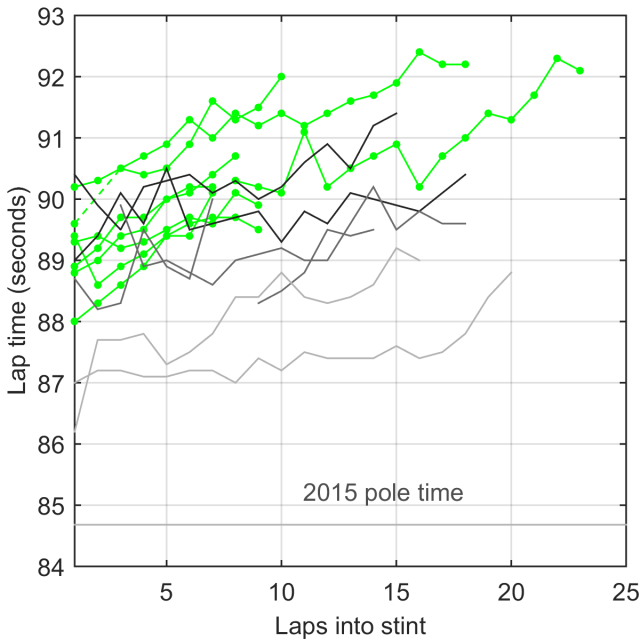
Mercedes were undoubtedly the most impressive outfit in testing, completing an unrivaled number of long runs. The graph below shows the impressive collection of posted runs on medium rubber.
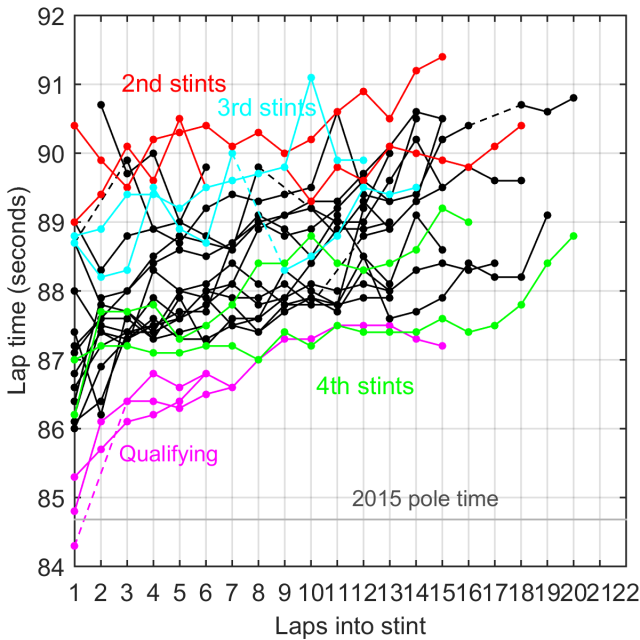
Among these are confirmed race simulation stints (2nd stints, 3rd stints, and 4th stints). These are helpful for anchoring the data, because we can be confident of how much fuel the cars were carrying. Given fuel accounts for ~0.05 seconds per lap, the theoretical difference between consecutive stints should be ~0.8-1.0 seconds, which is in close agreement with the data above. Using this information we will shortly be able to guess the most likely fuel loads for unknown stints, helped by the fact that fuel loads are quantized (i.e., we’re likely to see fuel loads corresponding to specific race stints, rather than amounts that fall somewhere in between).
In addition, we can see some runs that I have labeled “Qualifying”, which started with a very fast lap. One of these laps is faster than the 2015 pole time, although this is not necessarily meaningful, as times tend to be faster in the colder air of preseason testing. Notably, these “Qualifying” stints continued for several extra laps, one of them even turning into what looks like a 4th stint simulation. This implies that Mercedes have at least a few extra tenths in qualifying trim that they have yet to show if they drop fuel to the minimum needed.
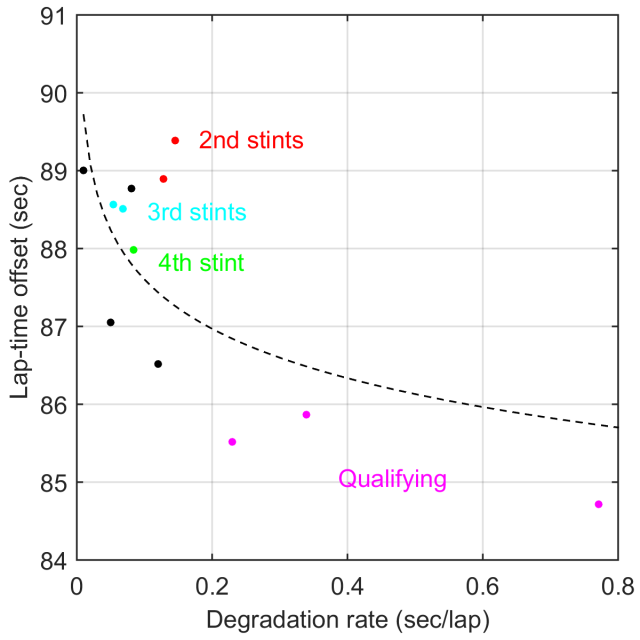
One of the key observations from my last post was an apparent relationship between the rate of degradation in lap-times (due to tyre wear) and the level of lap-times achieved. With more data, I explored this relationship in detail, turning up some incredible findings. For each stint, I fit a line (with slope and offset) to the lap-times. Below I plotted the offset versus the slope for all Mercedes medium stints.
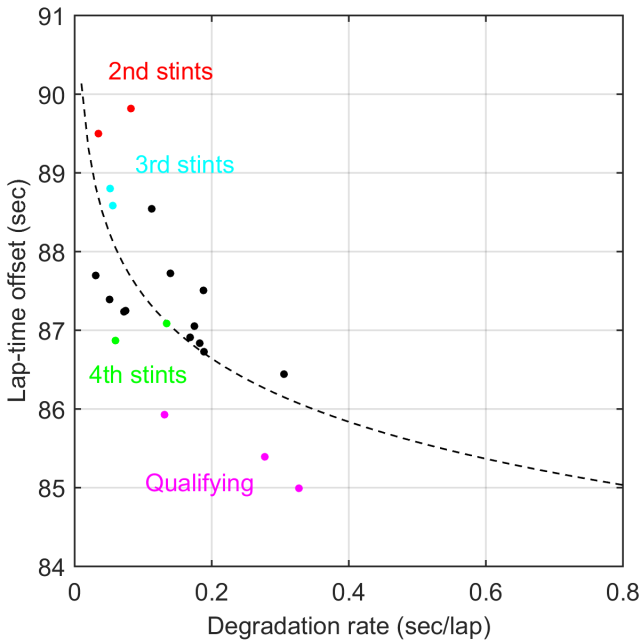
In general, higher degradation rates correspond to lower lap-time offsets, which makes sense, because the harder a driver pushes the higher their degradation rate will be. We thus begin to form a picture of how hard the tyres were being pushed in each stint. The points further to the right were when the driver was pushing very hard, and the points further to the left were when the driver was carefully preserving the tyres.
Other factors that affect lap-time (e.g., set-up and track conditions) will cause points to fall higher or lower than the expected trend. Looking at the highlighted points, the effect of fuel is obvious. 2nd stints are ~1-2 seconds too slow relative to the trend line, 3rd stints are ~0.5 seconds too slow, 4th stints are ~0-1.5 seconds too fast, and qualifying stints are ~1 second too fast.
We can then fuel-correct the data to produce estimated times if all runs had been conducted at approximately a 4th-stint fuel load. This produces the graph below.
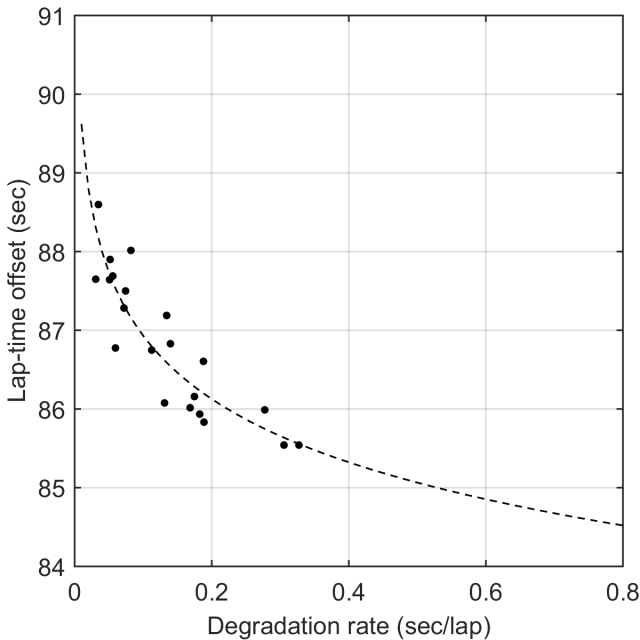
Now we see a very clean relationship between degradation rate and lap-times, which tells us a great deal about how the Pirelli tyres behave. To fit the data I used a power law function, L-L0 = b/D^k, where L is the lap-time offset and D is the degradation rate. I chose this function on the reasoning that (i) there should be little additional gain as the driver pushes up to the tyre’s limits; and (ii) as tyre degradation rate goes all the way to zero, lap-times should theoretically asymptote to infinity.
Using this curve, we can ask what is the optimal way to drive a given stint. If the objective is to complete one lap as quickly as possible (e.g., in qualifying), it is obviously optimal to push as hard as possible. If, however, a driver needs to cover a longer stint, it may be optimal to run slower lap-times with the benefit of a lower degradation rate across the stint.
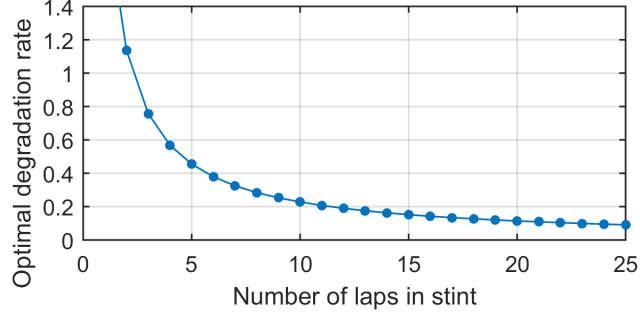
The graph above shows how the Pirelli medium compound should be driven in the Mercedes car to optimize the time taken to cover a stint of given length at the Barcelona circuit. For stints shorter than about 3 laps, it is time-optimal to push the tyre as hard as possible. For anything longer than about 5 laps, the tyre needs careful management to get the best out of it. At a stint length of 18 laps (typical for a race stint), it’s best to degrade the tyre at a rate of 0.13 sec/lap.
This qualitative relationship between lap-time and tyre wear will hold for any tyre, but the specific quantitative relationship we see here is a description of the Pirelli tyre dynamics and gives a graphical explanation of why drivers very carefully manage these tyres for all but the shortest stints. This is made clearer by the graph below, which shows how the average lap-time across an 18-lap stint depends on the driver’s choice of degradation rate (i.e., how hard they push).
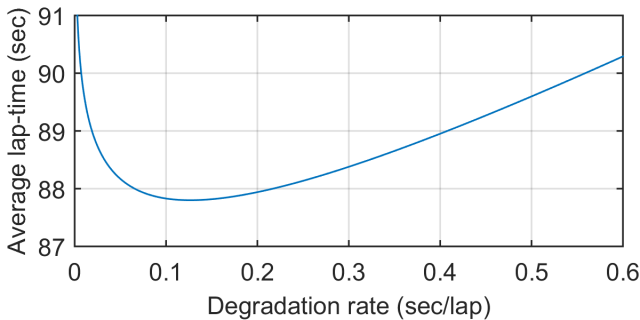
Increasing the degradation rate from the optimal 0.13 sec/lap to 0.26 sec/lap results in an average loss of lap-time of 0.38 seconds, for a total of 6.8 seconds across the stint. On such margins are races won and lost. We can see now why mastering the degradation rate of the Pirellis is such an art form.
Ferrari
 After impressive early pace in the first Barcelona test, Ferrari ran into overheating problems early in the second Barcelona test as they tried to ramp up performance. However, they quickly turned these issues around, and resumed their quest to catch Mercedes. The consensus of many is that Ferrari have closed the gap to Mercedes and even have a worthy title challenger. Let’s see what the longer runs tell us.

Ferrari achieved considerably less running than Mercedes (64% of the mileage), but still produced a useful collection of runs on medium tyres. As for Mercedes, race simulation stints fall approximately where you would expect. There are a few shorter, quicker stints near the bottom, which I have labeled “Qualifying”.
Both Mercedes and Ferrari completed full race simulations, which are plotted together below.
From this comparison, the story is not completely clear. One has to be careful in just comparing mean times, as I have seen in a few places, because these stints contained occasional laps that were very slow (e.g., due to traffic), which have a big effect on the mean unless they are cleaned. In most stints the cars were matched to within about half a second. In the 2nd and 4th stints, however, Hamilton seemed much faster than others. In addition, Raikkonen used the hard tyre in the 4th stint (whereas others went soft-medium-medium-medium) and was no slower than Vettel there, suggesting Vettel may not have been pushing very hard in his 4th stint.
I therefore took a closer look at the other long runs on medium tyres, fitting regression lines to each stint.
We see a similar relationship between degradation rate and lap-time offset, as well as stratification of stints by fuel load. I did the same type of fuel-correction to lap-times as above, yielding a direct head-to-head comparison for Mercedes vs. Ferrari below.
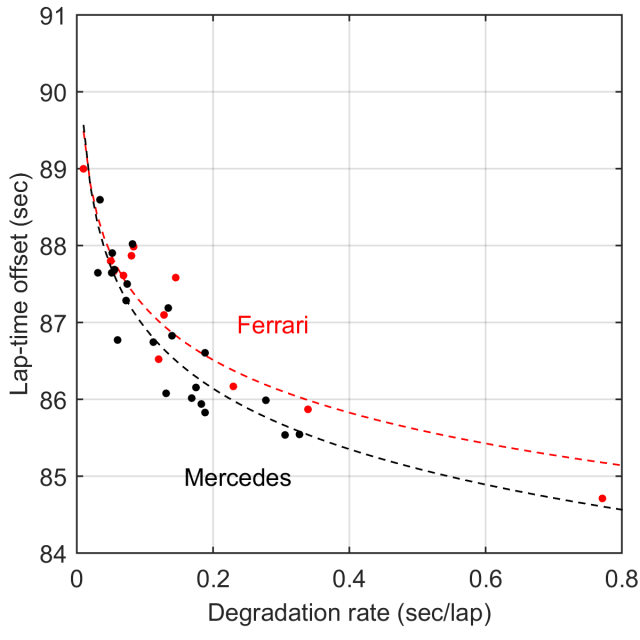
From this analysis I conclude that Mercedes remain the team to beat. However, the size of their advantage perhaps varies with degradation rate. In a typical race stint (degradation=0.13 sec/lap), the predicted advantage to Mercedes is just 2 tenths. When pushing much harder (degradation=0.4 sec/lap), the predicted advantage expands to 5 tenths. In both cases, this is a smaller difference than we had between the teams in 2015, which bodes well for the championship.
Estimated deficit to Mercedes: 0.2-0.5 seconds
Williams
The post-2013 Williams revival was catalyzed by their timely switch from Renault to Mercedes power. While Williams have not always maximized their on-track potential, the Symonds-led technical squad continue to deliver effective upgrades. As performance margins between power-units inevitably begin to close, the question is whether Williams will ultimately fall behind their better-funded rivals.
Below I plotted the Williams long runs in blue, along with the Mercedes 2nd, 3rd, and 4th stints of their race simulation in gray. From this comparison, we can conclude that the slowest Williams stint was likely using a 3rd-stint fuel load, while the other stints were likely a mix of 4th stints and qualifying runs.
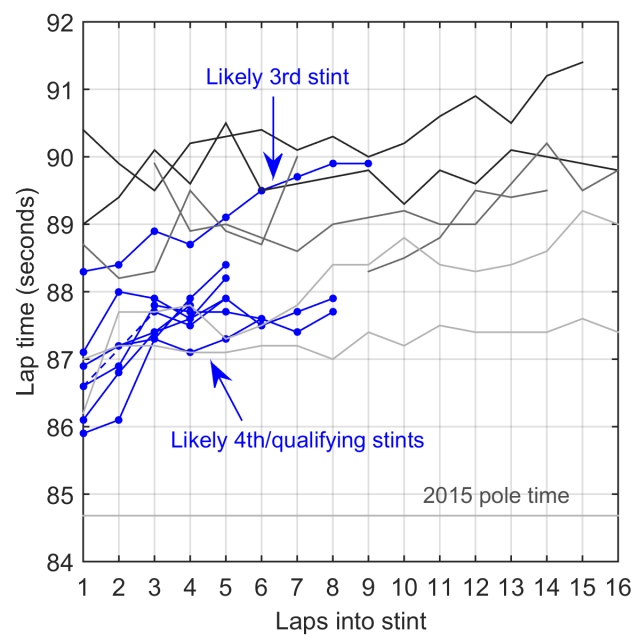
To fuel correct these data, I first added a fuel penalty to the quicker stints based on how many laps shorter than a full 4th stint they ran. I then corrected the other stints (in this case just the 3rd stint) after classifying them as 1st, 2nd, or 3rd stints based on their time difference from an expected 4th stint.
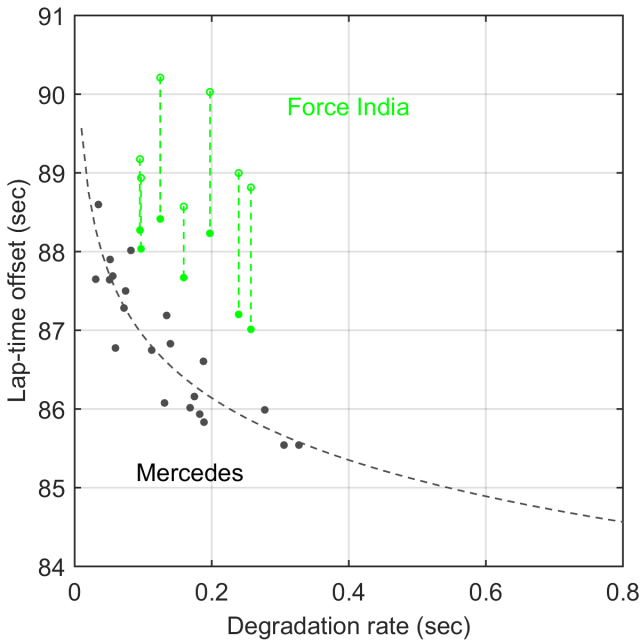
Below, these stints are compared to Mercedes’ fuel-corrected data. Original times are shown with open blue circles; fuel-corrected times are shown with filled blued circles and connected to the original time by a dashed line.
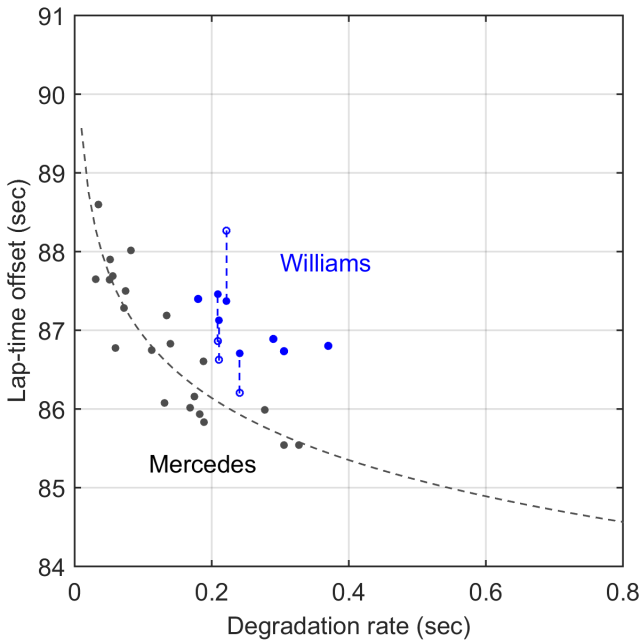
Since Williams have fewer runs than Mercedes or Ferrari, and over a narrower range of degradation rates, it would be inappropriate to fit a trend line. We can, however, estimate the time difference between the corrected Williams data and the Mercedes trend line.
Previous estimates by others, based on correcting lap-times only for tyre compounds, have put Williams as close as 2 tenths from Mercedes. My analysis of long-run stints, taking fuel-corrections into account, suggests the gap is currently a little over a second, which is close to the 8 tenths estimate derived by Andrew Benson.
Estimated deficit to Mercedes: 1.1-1.3 seconds
Red Bull
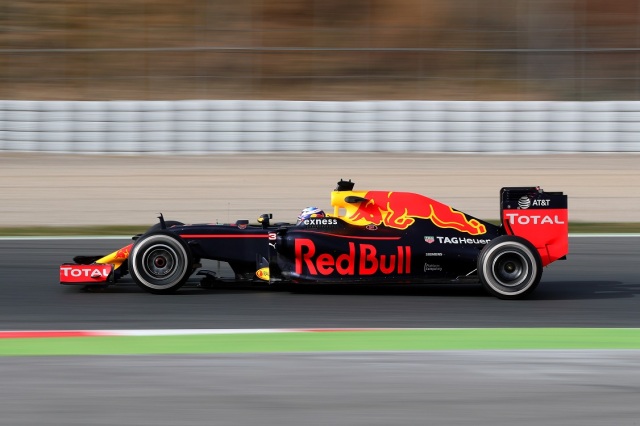
Red Bull gave us little to work with in terms of showing their outright pace, but they did complete some very long runs at a range of fuel loads, which are shown below.
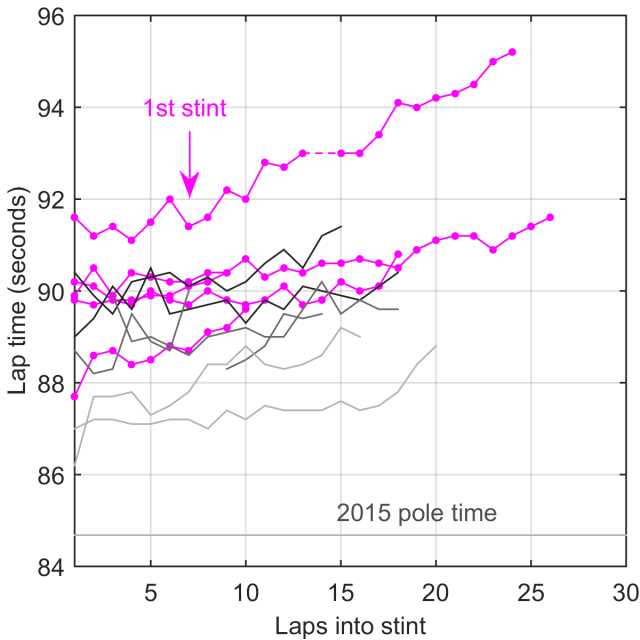
The most generous interpretation is that the top stint was completed at full race fuel, and indeed it is very similar to a 1st race stint from the 2015 Spanish Grand Prix. Taking that as the basis for fuel correcting the data, the other stints are likely a collection of 3rd stints and a brief 4th stint simulation.
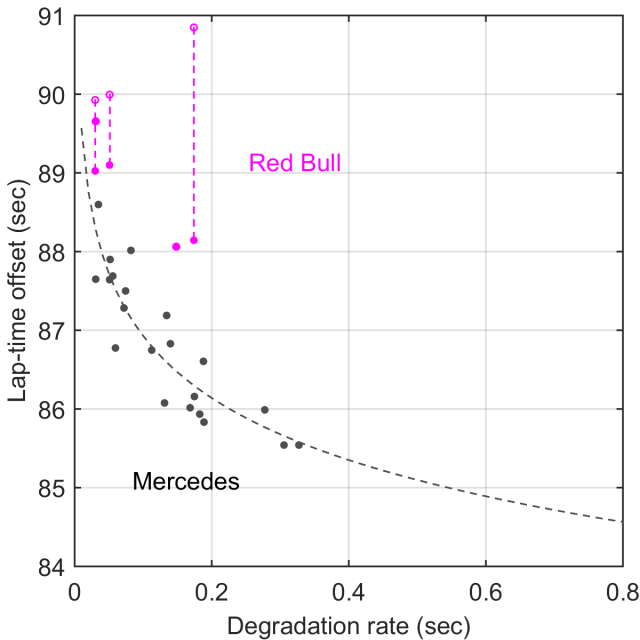
In my analysis after the first test, I noted that Red Bull’s performance was still a mystery and they would have a good chance of entering the title battle if Renault have made significant strides. I am now a bit more pessimistic about their chances. Instead, I think they will be in the mix with Williams and Toro Rosso for podiums, at least early in the season.
Estimated deficit to Mercedes: 1.0-1.6 sec
Toro Rosso
Given Toro Rosso only confirmed their engine supplier at a late stage of development, it was surprising to see such a well-packaged car, and even more surprising to see them complete 1,091 laps, beaten only by Mercedes with 1,329 laps. Among these laps were many long runs, including what looked like race simulations on 2nd, 3rd, and 4th stints, as well as some very fast qualifying runs.
As I did for Williams above, I first added a fuel penalty to the quicker stints based on how many laps shorter than a full 4th stint they ran. I then fuel corrected all other stints.
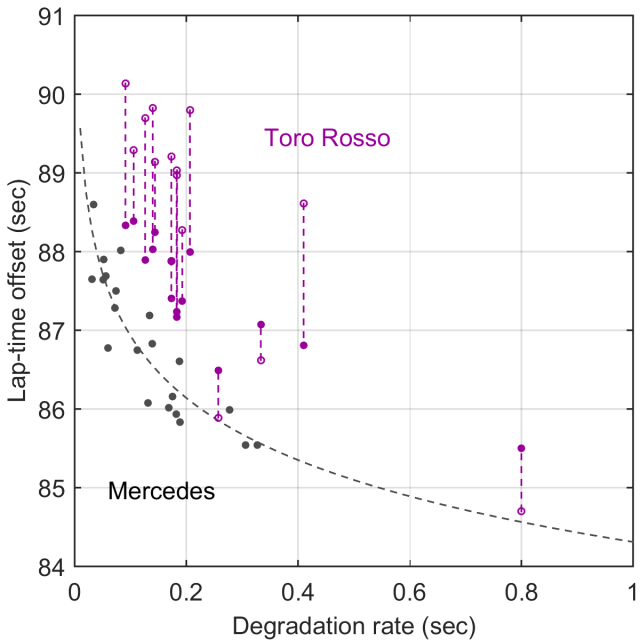
Comparing the adjusted data to Mercedes, Toro Rosso appear to be consistently within 1.5 seconds. That relationship holds even for the point far out to the right, where Sainz completed a qualifying simulation with two flying laps where he was pushing very hard.
Given how close Toro Rosso appear to Red Bull, and perhaps Williams, I think they are a serious dark horse for the 2016 season, with a good chance of picking up at least one podium.
Estimated deficit to Mercedes: 1.2-1.4 seconds
Force India
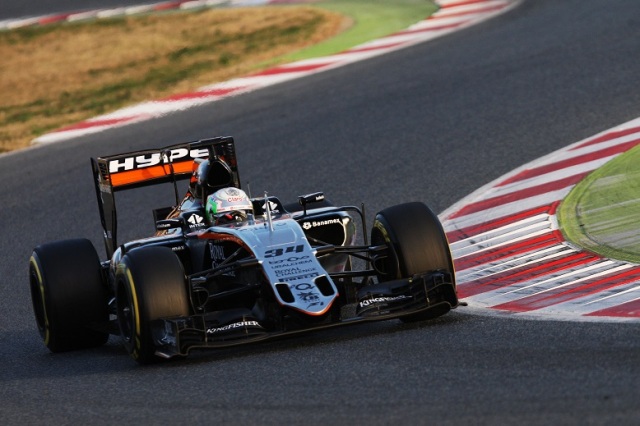
Force India made headlines in the first test with low-fueled hot-laps on supersoft rubber. Indeed, Hulkenberg’s fastest lap remained within 4 tenths of Ferrari’s best effort on ultrasofts by the end of preseason testing. This was a helpful distraction from Vijay Mallya’s ongoing financial troubles, but probably not indicative of Force India’s true performance, given most top teams were focused on race simulations with heavier fuel loads and low degradation rates. A look at the long runs completed by Force India on medium rubber gives a better indication of their current performance level.
This appears to include some shorter runs at lower fuel loads, as well as some 2nd and 3rd stints. Applying the same fuel-correction method to the data suggests a gap of about 1.4 seconds to Mercedes, which aligns well with earlier estimates.
The one great weapon in the Force India arsenal is of course still the Mercedes engine. At power tracks, they should therefore be mixing it for higher points places, but I expect their challenge to fade as the season progresses and their resources are diverted early to the 2017 regulations.
Estimated deficit to Mercedes: 1.3-1.5 sec
Renault
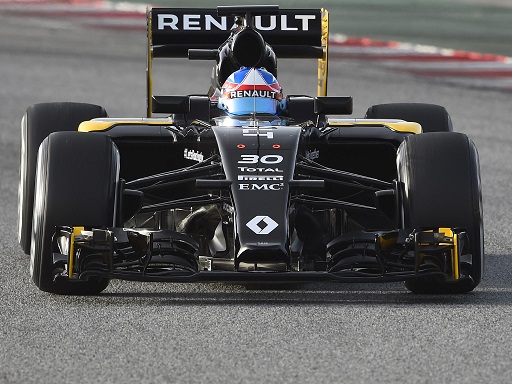
Going into 2016, I expected a disastrously uncompetitive car from the Enstone squad. Renault’s last-minute bail-out of the struggling Lotus team pointed towards a transitional year for the new works team. The 2015 Lotus chassis was not especially competitive, and it was hard to see how reverting to Renault engines could help matters.
From that difficult spot, Renault seem, based on testing data, to have put together a surprisingly competitive package. Moreover, the team has gained a talented driver in Magnussen, after earlier signing two lackluster pay-drivers to keep the team alive at a time when there was a threat of going into administration while Renault dithered on their decision.
Although there were reliability problems, Renault completed a respectable amount of mileage (782 laps), including several long stints plotted below.
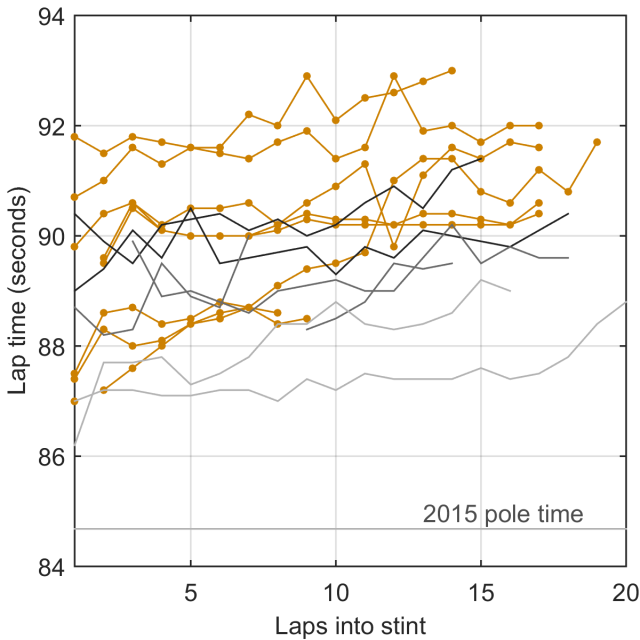
Using the same method of fuel correction described above, I compared these stints to Mercedes.
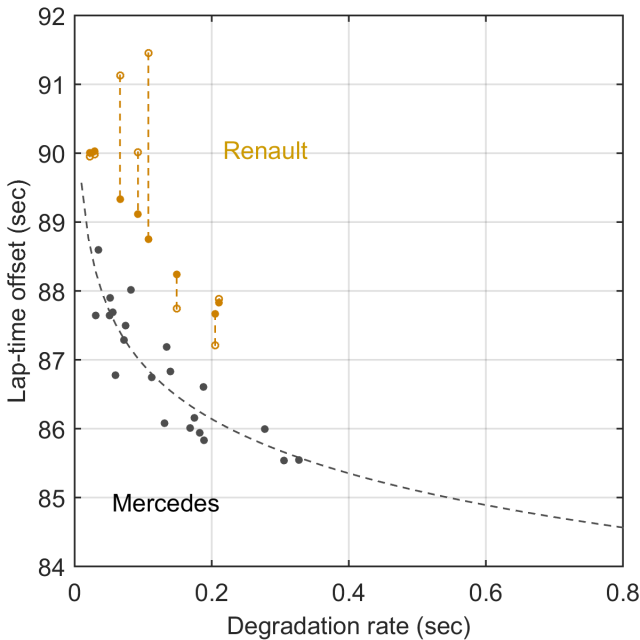
Overall, these data suggest that the works team are currently closer in performance to Red Bull than many expected, including the team themselves. As Magnussen has noted, however, Renault still need improvements in several areas before they can seriously challenge any of the top teams.
Estimated deficit to Mercedes: 1.6-1.8 sec
McLaren
The potential progress made by McLaren-Honda was one of the key talking points before preseason testing. Undoubtedly the team have made improvements on reliability and performance, but they still seem a long way from the front. Among their 707 laps were several long runs, graphed below.
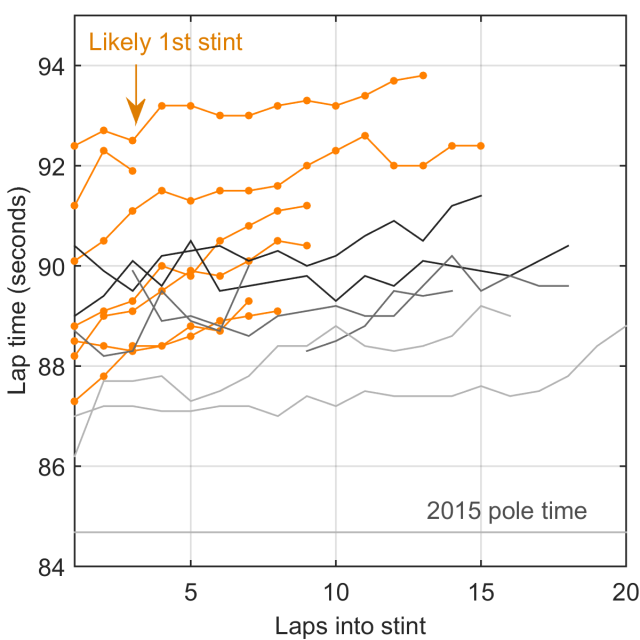
The slowest of these is very likely a 1st stint on full race fuel. Using this observation we can fuel correct the data, using the same approach as above.
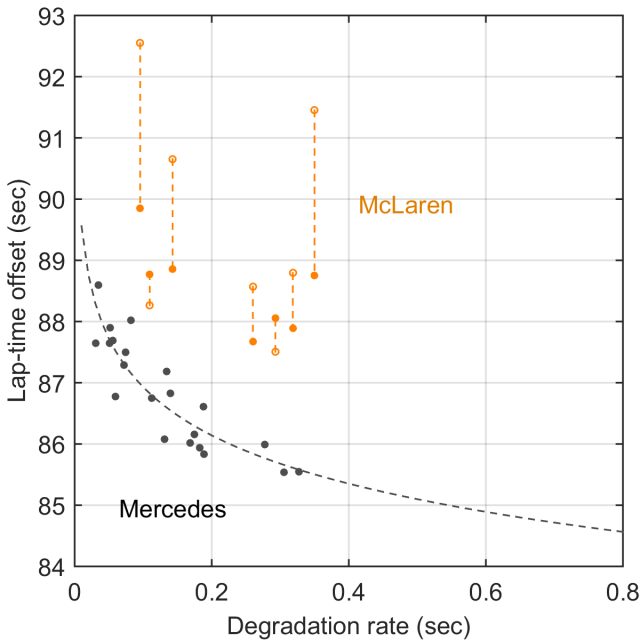
Overall, this analysis suggests McLaren is sitting a little over 2 seconds behind Mercedes, which is a slight improvement from 2015. Even after fuel correction, there is quite a bit of variability in McLaren’s timing data. This is possibly because they are still actively experimenting with different engine configurations. If we use only data from the 2nd test, McLaren are right around 2 seconds behind Mercedes. Honda made a big step forward between the two Barcelona tests. They need to make another significant step forward by the Australian Grand Prix, or they will find themselves at the tail end of a very heavily stacked midfield.
Given McLaren probably still have the strongest driver line-up in the sport, you cannot count them out from a podium under favorable circumstances at a favorable track, but it would take a small miracle for them to win a race in 2016.
Estimated deficit to Mercedes: 2.2-2.6 sec
Sauber
Sauber completed a decent amount of mileage in preseason testing (832 laps), but only debuted the 2016 car in the second test, showing how far they are behind schedule. Working in their favor is an upgrade to the 2016 Ferrari power-unit, which should give them a modest power advantage over Toro Rosso. Speed trap data suggest Sauber have gone for a lower drag and lower downforce design, a la Williams, as they were consistently quicker than anyone, including the Ferrari team.
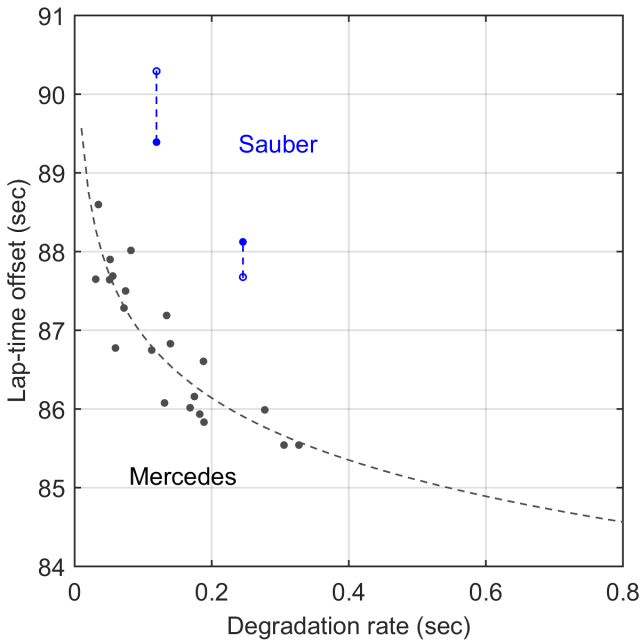
Finding long-run data for Sauber was challenging, but I identified two stints, which are plotted below.
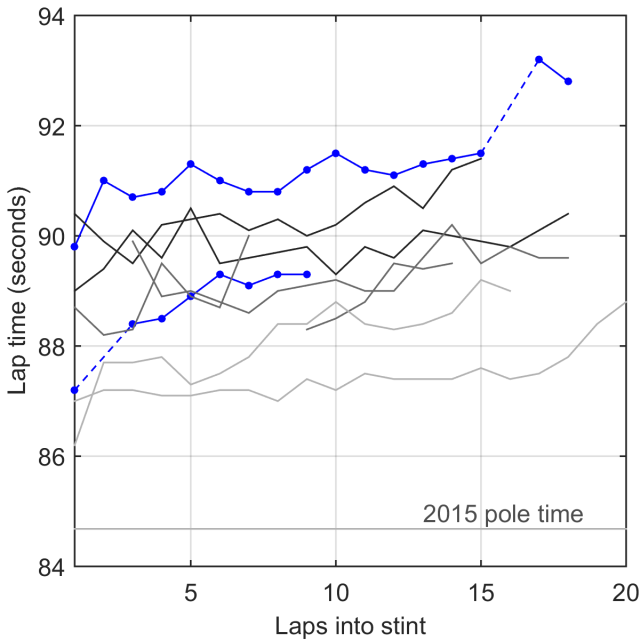
The quicker of these two stints appears to be a low-fuel run, starting with a hot-lap, which we can use to anchor the data for fuel correction. The longer stint seems most likely to be at a 3rd stint fuel load. Interestingly, the lap-times became significantly and suddenly worse near the end of this longer stint, which is a phenomenon I observed in a couple of other stints during testing. This may be due to the new design of the Pirelli tyres, which includes a second layer of much harder rubber that is reached after wearing through the outer layer, leading to a sudden drop in performance.
Comparing these two stints to Mercedes indicates that Sauber are currently 2+ seconds off the pace.
While Sauber were occasionally very competitive in 2015, especially early in the season, this looks like a much tougher season for the squad. A reasonable goal would be beating the Manor and Haas teams for 9th in the Constructors’ championship.
Estimated deficit to Mercedes: 2.2-2.7 sec
Manor & Haas
Posted data for these teams was insufficient for me to draw any confident conclusions about their long-run pace. Benson’s analysis of single lap times suggests that both these backmarker teams are within a second of Sauber and McLaren, and looking at the data I tend to agree. If this is correct, we will have a very competitive field in 2016, with no teams really lagging behind the pack as Manor did last year.
Summary
While I would still give an edge to Mercedes, Ferrari are showing initial signs of having closed the gap, perhaps to the point where this season’s championship battle could be a two-horse race. A little concerning is the fact that no other teams appear to be very close to Mercedes or Ferrari. To compensate, however, the battles of upper through lower midfield should be extremely tight. Not only do we have an extra team on the grid, both Manor and Haas look respectable, and may also be closely matched with one another. In all respects, this bodes for an entertaining season!

Great article, as always! I really like the speed-degradation curves.
Is there a reason why tire degradation seems higher in testing than in the race weekend?
I think there are a few reasons. First, we are seeing a range of degradation rates. On runs of race-stint length (~20 laps) they aren’t too far off what we typically see. Overall, it looks to me as though Pirelli have gone relatively aggressive this season, after being probably too conservative across most of 2014-2015. Also, the analysis here is for medium tyres; the Spanish circuit has a very high degradation rate, which is why the medium/hard are usually selected. This is probably why the SS and US are falling apart within a lap or two (although I didn’t discuss that in the article).
True, the hardest compounds are usually used at Catalunya, although the cold weather in winter testing might benefit the softer compounds. Based on the tire choices of the Australian Grand Prix it seems that the drivers prefer softer tires than the tires Pirelli generally supply (last year the compounds were soft and medium and this year the super-soft and soft tires are much more popular than the medium tire). If Pirelli have indeed gone more aggressive, then this season may be a very interesting one.
I didnt understand about Merc vs Ferrari something, you say that adventige varies, but what about mercs biger tyre consumption? They are faster, but wear tyre more, it has been like that since foundig of their team, doesn’t that mean Ferrari has an advantage? Not in speed but strategically?
What I’m seeing is that at the same level of tyre deg, the Mercedes is always quicker, but the difference is smaller at low deg levels (race) than high deg levels (qualifying). I should add that may be specific to the medium compound or to the Spanish circuit, but that’s all we really have to go on for now!
[…] kirjoittama analyysi Barcelonan testien pohjalta (https://f1metrics.wordpress.com/2016/03/06/2016-preseason-form-guide/) on huimaa luettavaa ja analyysi sellaisella tarkkuudella, että turha on yrittää heittää […]
I really hope the Mercedes is as good and as stable as the RB in the slow speed corners, and I have heard from a few people that it probably is just as good as the RB in slow speed corners. A few people on Twitter actually said to me the Mercedes looked better balanced than the Red Bull.
I want to ask a question. Is the Mercedes able to make their tyres last as long as the Red Bull and Ferrari this season? Mercedes have never be able to make their tyres last as long as Red Bull and Ferrari, but see this season, by the data, does it look like Merc are finally able to make their tyres last as long as Red Bull and Ferrari?
There is two things I am hoping for.
1. I am hoping Mercedes is just as good and as stable as the Red Bull in slow speed corners.
2. I hope Mercedes are finally able to make their tyres last as long as Red Bull and Ferrari.
Judging by the feedback I got on Twitter, I may just get number 1, but not sure about number two. Hopefully you are able to tell me if Merc are able to make their tyres last as long as Red Bull and Ferrari this season.
From the degradation curves, it looks as though Mercedes are fractionally quicker than Ferrari when driving to the same degradation targets, but the advantage lessens the longer the stint needs to run. That’s with the caveat that these analyses are only on medium tyres. If we follow this reasoning, we might see an advantage to Ferrari on longer stints with softer tyres, but there are then other factors that come into play, such as the different operating temperature ranges for different tyres.
I don’t think I have enough data to say anything confidently about Red Bull’s relative performance at high vs. low degradation target times.
Thanks for the article. Where does Mercedes’ “terrifying stint” from your ‘first look’ article fit into the big picture?
Ah, that’s the “qualifying” stint in the Mercedes lap-times graph that ends up running for 16 laps! This suggests they could go even quicker in qualifying trim with less fuel. At the time Mercedes ran that stint in the first test, Ferrari had not done any comparable runs. By the end of the second test they had a few low-fuel runs of their own.
Love your work !
The 0.2 to 0.5 sec between Mercedes and Ferrari is correct , of course this is true by using the available data , nothing more.
I am certain that Ferrari is hiding pace and they have been doing it in both tests.
Really nice work.
Will you be analysing Friday practice times to try and predict qually/race results? If yes, I look forward to some fascinating reads!!
Great analysis, thanks so much! I was wondering about the time of day as a factor? The morning runs generally seemed a lot quicker than the afternoon ones.
That’s a good point, as temperature will certainly have an effect, as will the amount of rubber laid down. Unfortunately I don’t have reliable temperature or time-of-day data for the stints.
[…] it’s good to get a little practice in using regular expressions… Via the wonderful F1 Metrics blog, I noticed that the @f1debrief twitter account had been tweeting laptimes from the F1 testing […]
so now that the first race of the season has taken place. How close were your predictions based on the practice data? Does that give you fresh data to update your models? Could that be used to predict how the cars would rank up during next race’s qualifying?
I second the previous comment. I think more or less your predictions/analysis was spot on. Would be good to hear if you think the same and maybe do some stint analysis from the actual race! 🙂
Btw, after seeing some data from the Aus GP, I would say a revision of McLaren in the pecking order is warranted. Button’s last stint on the Medium tyre seemed to match the Torro Rossos in clear air. I would say Mercedes>Ferrari>Williams>Red Bull>Torro Rosso>Haas>McLaren>Force India>Renault>Sauber>Manor.
The Toro Rossos weren’t in clean air and made major strategic errors. Verstappen should have finished 6th with the right strategy. In fact, the whole group of 6th to 10th was in reverse performance order due to the red flag and strategic errors!
I think McLaren are definitely ahead of Sauber now, but I wouldn’t put them ahead of Force India, and I’m not yet confident on where they are relative to Haas and Renault, but it looks close to me.
I was just thinking about fuel load adjusted fast laps today when looking at the first two races of data. Because fast lap has so many outliers and only a little correlation with finishing position.
And what do you know you have come up with some great analysis including Tire Degradation for good measure.
Fortunately Haas is running much better than testing suggests. If all things had worked out they could have gotten a points finish out of Gutierrez.
Haryanto is well off Wehrlein in many respects but Manor has made major steps with the Merc PU instead of a year old car. A points finish could very well materialize with attrition, luck and certain courses that allow for these sort of surprises.
[…] statistical analysis of testing performed by F1Metrics put the McHonda package some 2 seconds behind the impressive (and […]
Just wanted to ask if there’s any way of comparing the W05 vs. W06 vs. W07 on mid-season.
Do you mean in terms of their relative dominance or in terms of their lap times?
Hello,
a couple of months ago I heard about the possibility of an article regarding hypothetical scenarios where drivers drove for different teams in particular years. Is this still underway?
If you don’t mind, I’d like to propose a few alternate (and not unlikely) driver transfers which I think should be worth looking into:
Jackie Stewart going to Lotus for 1965-1967 instead of BRM.
John Surtees staying at Ferrari for 1966-1968 instead of going to Cooper and Honda.
Jochen Rindt remaining at Brabham for 1969-1970 instead of driving for Lotus.
Chris Amon staying put at Ferrari for 1970-1972 instead of going to March and Matra.
Emerson Fittipaldi choosing not to drive for Fittipaldi and instead staying at McLaren for 1976-1978.
Alan Jones driving for Ferrari in 1978 and 1979.
Jean Alesi choosing Williams over Ferrari for 1991-1993.
Michael Schumacher going to McLaren for 1996-2000 instead of Ferrari.
Nick Heidfeld being chosen by McLaren for 2002-2005.
Fernando Alonso going to Red Bull for 2008 and staying there until 2010.
Anyway, keep up the fantastic work. I look forward to your next post.
[…] than Grosjean or Perez for most of the stint. In preseason testing, I discovered that there is a very fine balance between pace and tyre conservation on Pirelli rubber, if one is to manage a stint optimally. Grosjean and Haas achieved what was probably close to the […]
[…] zullen de banden harder slijten dan wanneer ze het in de race rustig aandoen. Eerder dit jaar legde F1 metrics op basis van de wintertests het verband tussen snelheid en slijtage bloot op Circuit de […]
[…] starting, it’s worth revisiting last year’s pre-season analysis to demonstrate the value of this data analysis approach. When it comes to testing data, media focus […]
[…] for the season, which have often differed from predictions derived from the headline times. In 2016, I accurately predicted the gaps between the main competitors. In 2017, I focused on the top 3 […]