
A key question at the end of every Formula 1 season is: who was the best performing driver? There’s never a straightforward answer to this question, and usually only two or three teams could realistically win the drivers’ title, regardless of the quality of their drivers. This year, it was probably just one team, such was the Mercedes team’s advantage. Was the best-performing driver in a Mercedes in 2016, or might we have seen a different champion if all drivers were in equal equipment?
As I did for 2014 and 2015, as well as other seasons historically, I applied my model of driver and team performance to ranking driver performances in 2016. This model uses points per counting race as its performance metric. A “counting race” is defined by me as one in which a driver did not suffer a non-driver DNF (mechanical failure, technical disqualification, etc.). Excluding non-driver DNFs is designed to make the model rankings more robust to the effects of luck/misfortune, and mine is the only model that does this. The model also uses an extended points system to give fractional points to positions outside the top 10, allowing it to discriminate performance differences even among backmarkers. Data from all years of the championship (1950-2016) are used to estimate driver performances (including all-time rankings), and from this fitting procedure we can obtain estimates of driver and team performances in 2016.
The model is of course not omniscient, and cases can arise where the model’s rankings might fail to account for some other factor (some potential limitations were discussed here and here). For example, the model does not explicitly account for issues in qualifying or technical issues that slow the car but do not cause a DNF. In some years, by chance, a driver might have many such issues. As in previous years, I have therefore also performed my own more detailed analyses, which form the basis for the text written about each driver.
2016 driver rankings
Driver performances are quantified by the adjusted points per race (ppr) up to a maximum of 10 ppr, which represents how the model thinks each driver would have performed in completely equal cars. In other words, this is the driver’s predicted performance after adjusting for the model’s estimate of team performance.
Under each driver entry, I have included graphics showing the driver’s record relative to their teammate(s) in qualifying (excluding sessions where a driver set no time due to a technical issue), races (excluding non-counting races such as mechanical DNFs, DNSs, and technical DSQs), and points.
Technically, the Manor drivers are unranked by the model this year, because they are not connected to the rest of the grid by any other teammates. The same occurred for the Toro Rosso drivers in 2015 and the Marussia drivers in 2014. This year, following suggestions from readers, I have decided to include estimated rankings for the Manor drivers by assuming that the Manor and Sauber cars were approximately equal in performance on average across the season. This seems a reasonable guess, but it is a guess, which I have acknowledged with asterisks on the Manor driver rankings.
Stoffel Vandoorne is currently unranked, as I require a minimum of three counting races to give a driver a season ranking.
23. Esteban Gutierrez (2.53 ppr)
 Gutierrez was granted a third chance in Formula 1, ahead of many more talented potential rookies, on the basis that Haas wanted experienced drivers, and aided by his Ferrari and Carlos Slim connections. In 2014, Gutierrez was rated the season’s worst performer by my model, after being outperformed by teammate Sutil at Sauber, and he occupies the same position in the ranking list this year.
On paper, Gutierrez was outscored 29 to nil by Grosjean, who is himself ranked a mid-level driver by the model. On closer examination, this is a little harsh on Gutierrez. The Haas team’s performance changed erratically from one weekend to the next. Across the season, Gutierrez matched Grosjean 7-7 in races, but on weekends when Haas were in with a chance of points, Gutierrez usually encountered problems, including mechanical issues in Bahrain and the USA. However, he also had a hand in his own fortunes, causing a collision that ruined his race in Russia, contributing to the collision with Alonso in Australia by changing line in the braking zone, and making a very poor start in Austria. Haas have understandably chosen a replacement for 2017, so Gutierrez will now need to seek a remaining seat at Sauber or Manor.
22. Rio Haryanto (3.09 ppr*)
*Value based on the assumption that the Manor and Sauber cars were approximately equal in performance across the season.

Expectations for Haryanto were understandably low going into 2016. Four seasons in GP2 netted no better than 4th in the championship. Of the drivers on the 2016 grid, he was ranked lowest by my junior career achievement metric. In qualifying, Haryanto exceeded expectations, giving Wehrlein a close fight. In races, however, it was a complete whitewash versus the Mercedes junior.
21. Jolyon Palmer (3.89 ppr)
 Palmer came into Formula 1 as a GP2 champion, but with the significant caveat that he had taken four seasons to achieve that feat, and was beaten by his teammates in other seasons. His junior career was unconventional, starting with just one year of karting, before moving to T-Cars. From there he graduated to his father’s Formula Palmer Audi series, and then Formula 2, where he was beaten to the title in his second year by the rookie Dean Stoneman.
In general, Palmer’s rookie results in junior series were poor — 5th in T-Cars, 10th in Formula Palmer Audi, 21st in Formula 2, and 28th in GP2 — but he improved from there. His relatively competitive rookie season in Formula 1 against the more experienced and more highly rated Magnussen was therefore quite a surprise, and it will be interesting to observe his trajectory next year. He may not have been Renault’s first choice for 2017, but he will retain a seat there, this time alongside Hulkenberg.
20. Nico Hulkenberg (4.19 ppr)

2016 was another fairly disappointing season for Hulkenberg, trailing Perez in all categories except qualifying. Force India delivered their most competitive car ever, allowing Perez to rack up two podiums. A first podium somehow continues to elude Hulkenberg and he is now just 11 starts away from reaching Sutil’s record of 128 starts without a podium.
Hulkenberg’s move to Renault next year seems a well calculated gamble. For now, Force India are much more competitive, but a works team always has great growth potential, especially if Renault can unlock additional engine performance with the removal of the token system.
19. Esteban Ocon (4.46 ppr*)
*Value based on the assumption that the Manor and Sauber cars were approximately equal in performance across the season.
 Ocon was presented with the challenge of joining Manor mid-season, alongside a teammate with whom he is in direct competition for future advancement as a Mercedes junior. Moreover, he joined the sport to considerable hype, billed as the driver who beat Max Verstappen in Formula 3. This direct comparison is of course somewhat misleading — in the same way that the Senna-Brundle comparison in British F3 is misleading — since one driver had far less single-seater experience than the other. While Ocon’s rookie Euro Formula 3 and GP3 crowns were hugely impressive, his results in Formula Renault 2.0 were somewhat less convincing. Like his teammate Wehrlein, he also skipped the higher tiers of junior single-seater racing, going to Formula 1 via a brief stint in DTM.
In these circumstances, Ocon could have been forgiven for crumbling under the pressure. Instead, he showed himself capable of matching Wehrlein, even beating him 5-3 in head-to-head race results. While I think it’s still unclear which driver has the greater potential, and whether either has the goods to be a Formula 1 champion, Mercedes seem to be putting their money on Ocon for now, with a promotion to the Force India team in 2017, where he can be assessed against the well-rounded Perez.
18. Kevin Magnussen (4.50 ppr)

The parallels between Jan Magnussen’s and Kevin Magnussen’s careers continue. Both were very impressive juniors. Both were picked up by McLaren, debuted with them (Jan making only a one race appearance), and then were unceremoniously dumped. Both then got a second chance at a lower-rated team with new manufacturer backing (Stewart with Ford, and the recently rebranded Renault team, respectively), but failed to really impress in that position. Jan was pitted against Barrichello at the Stewart team and was soundly beaten. Kevin had a seemingly easy opponent in Jolyon Palmer, yet was often under pressure. Overall, Magnussen surely had the more impressive season, as he delivered most of Renault’s points. His impressive 7th place in Russia gave Renault a comfortable cushion over Manor and Sauber for the rest of the season. Nevertheless, in his position, I would have expected a top-level driver to beat Palmer in nearly every race. Instead, it was a 50-50 split, and the pair were usually running similar times.
For what it is worth, the model’s rating of Magnussen must still be quite uncertain. Palmer was an unknown quantity and Magnussen faced Button as a rookie in his one other season. Next year, when Magnussen pairs with Grosjean at Haas, should give us a more reliable assessment of his abilities.
17. Pascal Wehrlein (4.66 ppr*)
*Value based on the assumption that the Manor and Sauber cars were approximately equal in performance across the season.
 Wehrlein had an interesting season, in which he first asserted himself against an archetypal pay-driver teammate in Haryanto, before being joined by the more challenging Esteban Ocon. The first battle was clearly in Wehrlein’s favor. The second battle was much closer, with no clear victor.

Wehrlein himself remains something of an unknown quantity, and I expect he will be retained for another year at Manor. Like the other Mercedes junior, Ocon, he was never assessed in junior single-seater categories more powerful than Formula 3. Given there are many examples of drivers who were extremely promising up to this level but not beyond, this places great uncertainty over Wehrlein’s and Ocon’s ultimate potential, and the Mercedes junior program’s decision to take drivers out of single-seaters to DTM at this critical phase. For now, both seats at the Mercedes works team remain occupied and highly coveted, so Mercedes should be in no rush to finish assessment of their junior drivers, wherever they may place them in the meantime.
16. Felipe Massa (4.91 ppr)
 Felipe Massa chose to call time on his Formula 1 career at the end of 2016. With Williams eager to tap into the enormous financial support of billionaire Lawrence Stroll, and Bottas now looking the clearly better driver, Massa would have needed to find a new team. And with no seats open at any top teams, he would likely have been left dabbling in the midfield or lower. For a driver who came close to capturing a world title, and is acutely aware of the risks of the sport (which will likely rise dramatically next year), now seems as good a time as any to bow out. A more detailed analysis of Massa’s career is presented in Jenson Button’s entry below.
15. Daniil Kvyat (5.03 ppr)

As the 2016 season neared its end, Kvyat’s Formula 1 career seemed unsalvageable. Trounced by both Ricciardo and Sainz in the same season, and with Red Bull junior Pierre Gasly leading (and ultimately winning) the GP2 championship, Kvyat’s fate was surely sealed. Instead, Red Bull retained Kvyat at Toro Rosso for 2017, perhaps seeing the value in keeping a good (if not great) driver when their three other drivers are all currently hot commodities and could easily be on the move to other teams shortly. What this all means for Gasly is unclear. With the GP2 title achieved, he is not allowed to continue in the series, so may need to take up a holding pattern in Super Formula or elsewhere. 
Red Bull’s decision to ditch Kvyat so early in the season was utterly ruthless. Admittedly, he was outclassed by Ricciardo in their four races together. Even in China, where he scored a podium and inexplicably achieved driver of the day, Kvyat was no quicker than teammate Ricciardo, who was busy recovering through traffic.
Okay, but what about the fact that Kvyat was close to Ricciardo in 2015? By my count last year, Kvyat was the better performer in 7 of the 16 races where a meaningful comparison could be made. The problem for Kvyat is that many of these favorable cases arose due to self-sabotage on Ricciardo’s part. Ricciardo was undoubtedly the quicker driver for most of 2015, but also frequently causing collisions. I suspect Red Bull viewed this for what it probably was: an anomalous season for Ricciardo relative to his usually very clean record. If Ricciardo could continue to be quick and return to his usual level of circumspection, what hope would there be for Kvyat? And so, combined with pressure from Verstappen’s camp, Red Bull pulled the trigger.
Could Kvyat somehow find his way back to Red Bull from here? It’s certainly not out of the question, but at a minimum I think he would need to beat Sainz next year.
14. Romain Grosjean (5.06 ppr)

Grosjean’s move to Haas — effectively the Ferrari B-team — seemed a masterstroke in terms of positioning himself for a Ferrari seat in 2017. Expectations for Haas were modest, and Grosjean exceeded them with impressive points hauls in three of the first four races. This success could be largely attributed to mastery of strategy and tyre management. Before other teams caught on, Haas were running many-stop races on the softest available compound.
Taking Bahrain as a case study, Grosjean and Gutierrez were among six drivers to choose 7 supersoft sets for the weekend. The others were the Renault and Williams drivers. These drivers therefore had the advantage of running several race stints on fresh supersofts. Williams conceded this advantage by using all their available supersoft sets in practice and qualifying, forcing them into a much slower two-stop race.
Haas ran a three-stop race, with three sets of supersofts and one set of softs. Magnussen and Perez did the same, having saved tyres due to problems in qualifying. Perez’s strategy was compromised badly by needing to stop on lap 2 with damage. Magnussen theoretically had a great strategy, albeit hindered by having to start from the back.
If we overlay the supersoft stints for these three drivers, after fuel-correcting the times for each stint and removing laps spent in traffic, we see the following.

Perez started his stints quickest of all, but also degraded his tyres the quickest. Magnussen kept his tyres alive the longest, but at the cost of being slower than Grosjean or Perez for most of the stint. In preseason testing, I discovered that there is a very fine balance between pace and tyre conservation on Pirelli rubber, if one is to manage a stint optimally. Grosjean and Haas achieved what was probably close to the optimal balance, which translated into a significant time advantage.
As the season progressed, things got more difficult for Haas and Grosjean. Other teams caught on to their tyre tactics, the chief strategist moved to Sauber, and issues arose in other areas, including the braking system. Meanwhile, Raikkonen looked increasingly capable at Ferrari, and Grosjean’s advantage over Gutierrez became less convincing. Grosjean also threw away a golden opportunity for points in Brazil. All of this has undermined Grosjean’s planned path to Ferrari, but he will remain at Haas in 2017 with a new teammate in Magnussen.
13. Marcus Ericsson (5.42 ppr)
 2016 could be considered something of a breakthrough season for Ericsson. While he was an exceptional driver in his early junior career up to the level of Formula 3, little success followed in GP2 or Formula 1. Losing outright to a rookie teammate last year might have been enough to end some careers, but his strong financial backing makes him a valuable commodity for teams in the lower midfield. Moreover, his results in 2016 should elevate his reputation as a driver, in much the same way that Perez’s reputation has benefited from his results alongside Hulkenberg at Force India.
12. Sergio Perez (5.57 ppr)

2016 was another strong season for Perez, finishing a career-best 7th in the championship ahead of both Williams drivers. As Perez and Hulkenberg end their three-year partnership, the overall head-to-head tallies stand at 34-24 to Hulkenberg in qualifying, 27-24 to Perez in races, and 238-226 to Perez in points. As the table below indicates, they are among the most balanced teammates in history.

The most and least balanced teammate match-ups in history, using ratio of race results as the metric (non-driver DNFs are excluded). A total tally of at least 20 races is required for inclusion.
The Force India car started the season at a similar performance level to my preseason predictions from testing, but advanced impressively across the season, despite their relatively limited budget. One hopes that in the battle for 4th with Williams, they have not diverted too many resources away from the 2017 development effort.
11. Felipe Nasr (5.69 ppr)
 Nasr had a spectacular rookie year in 2015, beating Ericsson convincingly in all areas. In theory, 2016 should have been even better, with the experience difference between the teammates no longer counting for as much. Instead, we saw a much less convincing performance from Nasr. It was a classic example of what is called the “sophomore slump” or “second year syndrome” in other sports and areas. On the majority of weekends, he was beaten by Ericsson in both qualifying and the race.
The one major positive for Nasr was that he scored all of Sauber’s points in his cleverly managed drive in atrocious conditions in Brazil. Since the model’s performance metric is points per counting race, Nasr is ranked ahead of Ericsson by virtue of that one great performance. Is this a case of the performance metric giving unreasonable weight to a single race? Arguably so. On the other hand, points are the sole objective in Formula 1.
Nasr’s two points proved to be critical for Sauber, lifting them to 10th in the constructors’ championship, guaranteeing continued FOM prize money, and thus hopefully keeping them clear of the looming precipice. Now, Manor will face these difficulties, and ironically it remains unclear whether Nasr himself will secure a seat for next year — Ericsson may actually be the main beneficiary. Enthusiasm for Nasr’s services was undoubtedly dampened by him trailing his teammate for most of the year.
Given Nasr’s performance, I decided to investigate whether the sophomore slump is the norm in Formula 1. Below is a graph of the difference in model-estimated driver performance relative to the rookie year in each subsequent year of a driver’s career. This uses all driver careers from 1950-2016.

Average change in performance relative to the rookie year, using the model’s performance metric. The blue line indicates the mean, while the red lines indicate the standard error of the mean.
In general, performances improve both from the first to second year and from the second to third year of a Formula 1 driver’s career. Currently, I am trying to improve my model by incorporating both this experience effect and the age effect I investigated last year.
10. Valtteri Bottas (6.13 ppr)

 A three-year partnership between Bottas and Massa has allowed a clear assessment of Bottas’s abilities relative to others on the grid — something that I think we lacked at the end of 2014. In qualifying, Bottas is undoubtedly the quicker Williams driver, beating Massa 39-18 overall across 2014-2016. In races, the record between the teammates is much closer, with Bottas ahead 26-23, and in points 407-308. In the table below, we can see how these statistics compare to Massa’s other long-term teammates.
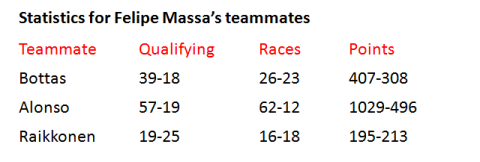
These results suggest Bottas is still somewhere below the very top drivers, but nevertheless a valuable driver for a team like Williams.
9. Jenson Button (6.51 ppr)

 2016 is likely Button’s final year of Formula 1, as McLaren have finally allocated a full-time seat for Stoffel Vandoorne. Overall, it was a solid season for Button, in which he kept Alonso honest. The overall advantage to Alonso across 2015-2016 stands at 22-9 in qualifying, 14-9 in races, and 65-37 in points.
As they reach retirement, it is interesting to check out the model’s performance ratings for Button and Massa across their Formula 1 careers.

Massa achieved a distinct peak of performance in 2008-2009, thereafter returning to a similar performance level to 2007 and before. It is impossible to say whether this change in 2010 was due to a combination of age, demotivation at Ferrari alongside Alonso, and/or his injury at Hungary 2009.
Button’s performance was near zenith in 2006, 2011, and 2015. His performance slumped temporarily in 2008, in a hideously uncompetitive Honda. Interestingly, Button’s championship-winning season in 2009 is only rated around average relative to his overall career. By the model’s reckoning, Button is still performing close to his peak.
8. Kimi Raikkonen (6.51 ppr)


In 2015, many fans and pundits (including myself) were considering the best replacement for Raikkonen at Ferrari. As I noted in last year’s review, none of the most probable replacements (Perez, Grosjean, and Bottas) were actually rated significantly higher than Raikkonen, bringing into question the wisdom of replacing him at all. The obvious potential downside to Raikkonen is the cost, but that is offset to some degree by his easy working relationship with Vettel and his continued marketability. Ferrari’s decision to retain Raikkonen seems well justified now, given how close he got to Vettel. The narrowing gap between the two drivers is explored in detail in Vettel’s entry below.
Whether the gap between Raikkonen and Vettel has closed due to an improvement from Raikkonen, a decline from Vettel, or some combination thereof, it is difficult to say. To my eyes, Raikkonen looked considerably sharper this year, reacting more accurately when the car began to misbehave under braking or acceleration than in 2015, and with fewer sloppy errors. Vettel for his part looked more error-prone and less comfortable in the 2016 chassis. It will be fascinating to watch how this teammate battle evolves with the new, quicker cars in 2017, especially as Raikkonen will turn 38 next year, which is the average age at which Formula 1 driver performances begin to precipitously decline, based on my analysis of age effects last year.
7. Nico Rosberg (6.66 ppr)


Rosberg’s championship win in 2016 seemed to divide fans into two camps. Those who argued Hamilton was the quicker driver for the majority of the season, hamstrung by worse reliability, versus those who argued Rosberg was near enough to Hamilton over a prolonged period to demonstrate that he is a worthy champion. Certainly there is truth to both sides.
When we start to decide which drivers are “deserving” champions, we of course open a can of worms. On a per-season basis, my model judges that the driver who won the drivers’ title was the best performer in only 27 out of of 67 years from 1950-2016. In most cases, they won by satisfying the most important requirement: being in the season’s best car. And in three previous years, the champion’s teammate is actually rated the year’s best performing driver: Fangio in 1950, Prost in 1984, and Prost in 1988.
I previously wrote in detail about the relative strengths and weaknesses of Rosberg and Hamilton, and the picture seems even clearer now. The overall record between the two now stands at 30-24 to Hamilton in qualifying, 37-29 to Hamilton in races (excluding non-driver DNFs), and 1334-1195 to Hamilton in points. It rarely gets much closer than that between top teammates. In an era of single-team dominance, we should continue to be very thankful for that.
6. Lewis Hamilton (6.98 ppr)


Hamilton’s season was filled with drama from beginning to end. Like Mansell in 1987 and Prost in 1984, he finished the season behind his teammate by a small margin, despite winning more races and generally looking the quicker driver. Hamilton’s cause was not helped by poor reliability, and he is rated slightly ahead of his teammate by the model.
A frequent talking point was Hamilton’s starts. It was widely perceived that he was more often on the back foot on the first lap than others. This was my perception too, but the data don’t really support it. Below is a graph of Hamilton’s and Rosberg’s mean positions (when still running) at the start of the race, end of lap 1, and end of the race.

Hamilton’s average position at the start and end of lap 1 is pulled down by issues in qualifying and grid penalties, including starts from 10th, 21st, and 22nd. Impressively, he averaged a slightly better finishing position than Rosberg despite this handicap. If we only include the races where Hamilton was free of technical issues in qualifying, we see that Hamilton actually averaged very similar positions to Rosberg at the start and end of lap 1. I included Baku, because that was not a technical issue (Hamilton crashed in Q3), but the trend is unchanged by excluding it, because he started and finished the first lap in 10th.
Notably, the model does not account for technical issues experienced in qualifying, and thus it has probably slightly underrated Hamilton’s performance this year.
5. Daniel Ricciardo (6.98 ppr)

 Ricciardo, in my view, had a spectacular season, and is unfortunate to be ranked “only” 5th by the model. This fact comes down to a confluence of factors. First, it’s clear that Ricciardo had some poor luck, including the puncture in China and the pit-stop blunder in Monaco. Spain might also be considered poor luck, although in that case I think there was a strong rationale for assigning Verstappen a potentially better strategy, since he was quicker than Ricciardo at that stage in the race and Vettel had just closed to within undercut distance of the two Red Bulls, so Red Bull had to make a difficult decision.
The second and most important factor in determining Ricciardo’s ranking is actually the role of Kvyat. On paper, Ricciardo’s 2016 record was excellent. He was closely matched with Verstappen overall — if anything, he had a slight edge — and he dominated Kvyat.

So, how then do we make sense of Ricciardo being ranked behind Sainz and Verstappen by the model? We can understand this easily by looking at the data that go into the model.
The model’s performance metric is points per counting race. This value can theoretically range from 0 to 10, due to the model’s use of a scoring system that awards 10 points for a win (explained in detail previously here). To avoid ceiling or floor effects, the points per counting race metric is converted into a linear performance measure using an inverse-sigmoid transform. This linear performance metric is then assumed to be predicted by a combination of driver and team performances, which the model tries to estimate. In the graphic below, we can see how the Toro Rosso (left) and Red Bull (right) driver performances in 2016 look relative to one another on this linear performance measure, using Verstappen as a baseline.

Kvyat was massively outperformed by all three drivers, but by a greater degree in terms of points per counting race at Toro Rosso than at Red Bull, which indirectly tells the model that Verstappen and Sainz probably performed at least as well as Ricciardo. This is an important point, but not the full story, because the model also uses previous season results (including Ricciardo and Kvyat’s 2015 results) to guess at the average performance level of each driver. The model assumes that drivers have some variance in their performance from year to year, but it is of course more probable that a driver performs close to their estimated mean level than far from that level. All of these pieces of evidence are used by the model to find the most probable explanation for all of the data (that is what fitting the model really means). In some cases, this requires finding a compromise between several pieces of evidence that individually seem to contradict one other. For example, a famous teammate triangle: Hill beating Villeneuve beating Frentzen beating Hill.
Ricciardo and Kvyat are also hurt in these rankings by the Red Bull car generally improving across 2016 and the Toro Rosso generally getting worse. Verstappen got the best of both teams (with a higher average scoring rate across the whole season than either of his teammates who remained stationary), while Kvyat got the worst of both teams. This is again a factor not considered in the model, which works based on season averages by assuming team and driver performances are relatively stable within a season (abandoning that assumption would mean a huge increase in the number of model parameters, and an inability to estimate many of these, especially in earlier seasons when there were fewer races, or for drivers who raced partial seasons). Finally, there is the fact that Kvyat’s performance likely suffered due to demotivation after he was demoted to Toro Rosso, which is not something we can easily quantify, and certainly not a factor in the model.
What we can say with some confidence is that Ricciardo, Verstappen, and Sainz appear to be a relatively closely matched group and that they are likely going to be among the top drivers as we move into this next generation. Three into two won’t go, so it will be fascinating to watch how Red Bull handles this driver dilemma, and whether any of the trio will try to negotiate a seat at another top team before Red Bull makes the decision for them.
4. Sebastian Vettel (7.21 ppr)


In 2015, Vettel was the model’s pick for best performing driver. His margin over Raikkonen that year was significant and he seemed to be invigorated by Ferrari’s unexpectedly large performance leap from 2014 to 2015. Expectations were low and therefore easily exceeded.
By contrast, Ferrari came into the 2016 season talking big results, and my analysis of preseason testing data suggested they weren’t far off Mercedes under race conditions. Indeed, Ferrari’s race pace in the early season was very good, but a combination of reliability issues and strategic blunders scuppered good chances of a race win in Australia, Bahrain, and Canada. Ultimately, they slid backwards from 3 wins in 2015 to zero in 2016, and fell to third in the constructors’ championship.
Vettel’s driving errors and continual radio outbursts both suggested a driver under strain. On the first lap, he repeatedly took unnecessary chances, getting tangled multiple times with other drivers. He surely cannot be happy with the direction the team are currently going, including the sudden loss of James Allison right as the sport moves into a more aero-dependent formula.
While Vettel still clearly had an edge on Raikkonen, the time margins were much smaller in 2016. In qualifying, the tally was 10-10 and the median time advantage decreased from 0.3% in 2015 to almost zero in 2016.

Bars show interquartile ranges and medians, with whiskers suppressed due to their large ranges, which are usually due to technical issues for one driver. Percentage differences are computed using the fastest time each driver set across all qualifying sessions in which they both ran without technical issues.
In races, Vettel’s advantage was also diminished this year, from a median advantage of 0.2% in 2015 to 0.1% in 2016.
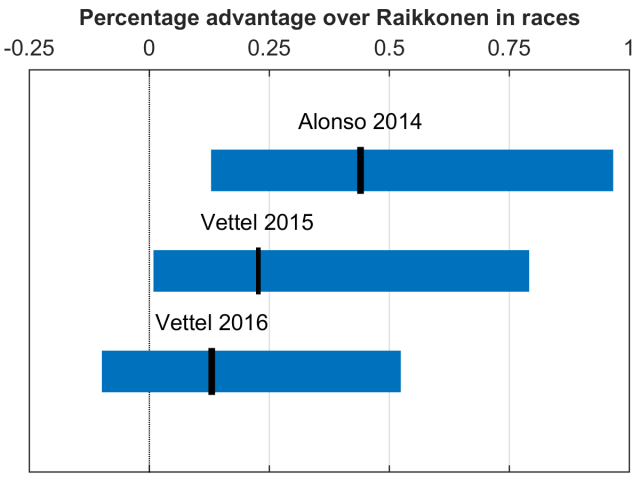
Bars show interquartile ranges and medians, with whiskers suppressed due to their large ranges, which are usually due to technical issues for one driver. Percentage differences are computed using all laps that both drivers completed in each race, excluding lap 1 and any laps affected by safety cars or virtual safety cars.
Vettel will obviously be hoping for much better results from Ferrari next year. It’s worth remembering that Michael Schumacher took five seasons to win his first title with Ferrari, and Alonso endured five seasons without any title there. Both those drivers came close to taking titles along the way, although more by virtue of their driving than the car. If the results aren’t there, will Vettel have the patience to stick with Ferrari for that long?
3. Carlos Sainz (7.26 ppr)


Sainz was arguably the surprise of the season. Last year, he was on close terms with Verstappen, but two factors counted against him. First, Verstappen took the much larger points haul. Second, Sainz came into Formula 1 with considerably more experience than Verstappen, and the advantage generally swung more to Verstappen as the season progressed, suggesting a persistent advantage to Verstappen would emerge once both became relatively experienced. Both of these factors continued into early 2016, with only Verstappen’s impetuous decision to pit early in Australia giving Sainz a favorable result. With Kvyat floundering and Verstappen already looking to have the better of his teammate, Red Bull made the audacious decision to promote Verstappen and demote Kvyat after only four races.

Sainz and Kvyat were contemporaneous juniors and were teammates along the way to Formula 1 several times. In their first year of single-seaters, they raced together for EuroInternational in the Formula BMW Europe and Pacific 2010 series. Overall, Sainz beat Kvyat 15-9 in races. They continued as teammates in Formula Renault 2.0 in 2010-2011, racing in multiple European series for Koiranen. The overall record this time was 21-17 to Sainz. The pair were then reunited as teammates at MW Arden in GP3 in 2013. This time Kvyat won the battle 10-5 and took an impressive rookie series title, while Sainz finished the championship 10th. Kvyat was thus promoted straight to Formula 1 in 2014, while Sainz recovered his reputation in Formula Renault 3.5 to earn his promotion in 2015.
The two drivers therefore know each other’s strengths and weaknesses intimately, and history would have suggested a close battle between them. Instead, Sainz utterly mopped the floor with a visibly despondent Kvyat. Would Kvyat have put up a stronger fight had he not just suffered the ego-crushing blow of demotion from the Red Bull team? Perhaps so, but then we enter the realm of the hypothetical. The numbers in reality are stark. Sainz outscored Kvyat 42-4. Kvyat’s best finish for Toro Rosso was 9th. Sainz finished 8th four times and 6th three times. Sainz was frequently fighting with faster cars and dragging his Toro Rosso into seemingly ridiculous positions, while Kvyat remained largely invisible and seemed to transform even predestined opportunities for better results (e.g., Brazil) into unremitting disasters.
Next year will provide additional data on the Sainz vs. Kvyat match-up. I would personally be surprised if it remains quite so one-sided, but if it does Sainz should be well on his way to being considered among the sport’s elite.
2. Max Verstappen (7.26 ppr)


Verstappen was without a doubt the star of the season as far as entertainment goes. In almost every race, he seemed to generate the major talking points. In some cases it was due to errors or controversial moves. In other cases it was due to brilliant tyre management or virtuoso drives, such as his unforgettable performance in Brazil.

Verstappen’s conduct in defensive driving came under extreme scrutiny in 2016. To many new fans, Verstappen appeared to be bringing a novel style of driving to the sport, but those who watched Formula 1 closely in the mid-1990s would have recognized most of Verstappen’s moves as coming straight from the Michael Schumacher playbook. The stewards largely turned a blind eye to this, letting Verstappen get away with weaving to break a slipstream in Silverstone (previously clarified as illegal) and making late defensive moves near the braking zone. To his credit, Verstappen was often operating just inside the limits of legality, such as when he closed the door on Raikkonen on the Kemmel straight after Raikkonen had committed but before he had any part of his car alongside Verstappen’s.
The most contentious issue was Verstappen frequently taking a middle-of-the-track line along a straight and then suddenly defending to the left or right in response to the movement of the attacking car, usually near the beginning of the braking zone. These moves could be argued to be part of a move back onto the racing line (which is technically allowed if moving to the outside, provided a car’s width is left there) or an early trail-braking line into the apex (if moving to the inside). The concern, however, is that these moves were reactive. As I wrote in my earlier post on the rules of racing,
On a straight, a defending driver has the right to suddenly change direction, even using the entire track width if they are fully ahead of the attacking driver. The same right does not apply in or immediately before the braking zone for a corner. Sudden changes of direction just before or within the braking zone are considered extremely dangerous, as they can leave the attacking driver nowhere to go. This rule is not stated explicitly in the FIA sporting regulations, but is considered an “abnormal change of direction” under sporting regulation 20.5

20.5 Manoeuvres liable to hinder other drivers, such as deliberate crowding of a car beyond the edge of the track or any other abnormal change of direction, are not permitted.

Obviously some change of direction is allowed within the braking zone — the optimal racing line usually involves some amount of trail-braking — so it is up to the stewards to decide what constitutes an “abnormal” amount of movement.
In short, there is significant gray area here, and Verstappen was exploiting it to the maximum. Ultimately, the FIA was forced to offer a clarification of regulation 20.5:
"...any change of direction under braking which results in another driver having to take evasive action will be considered abnormal and hence potentially dangerous to other drivers. Any such move will be reported to the stewards."
What it means for a driver to have to take evasive action is still somewhat unclear, and the clarification states that such moves have to be investigated, without actually stating what characteristics would make such a move legal vs. illegal.
While all of this was going on, the match-up between Verstappen and Ricciardo was a fascinating and complicated one. In qualifying, Ricciardo was the more successful driver. In races, each driver enjoyed several weekends where they clearly outpaced their teammate. Both drivers were incisive in their racecraft, and neither held a persistent advantage over the other in terms of tyre management. This is a match-up that thoroughly deserves a second season before any firm conclusion is reached. And while this driver pairing is happy-go-lucky for now, if Red Bull deliver a championship winning car next year, I expect sparks to fly.
1. Fernando Alonso (7.92 ppr)
 While nobody had a perfect season in 2016, the model is confident in choosing Alonso as the year’s stand-out driver. Remarkably, he finished the season with more points than Felipe Massa at Williams, and over double the points of his world champion teammate, Jenson Button. The McLaren car was certainly improved from 2015, but remained significantly down on power.
Alonso was able to maximize points scoring opportunities in three ways. First, he was extremely aggressive in his racecraft, even stepping across the line of acceptable conduct on occasion (e.g., his divebomb on Massa in the USA, for which he was lucky to not receive a penalty). Second, he was consistently very quick in qualifying, beating Button 15-3, although due to grid penalties his average starting position was only slightly better than Button’s. Third, and most important, he was extremely successful at gaining positions on the first lap, including 10-place gains (22nd to 12th) in both Belgium and Malaysia. Alonso has always been one of the strongest drivers on the first lap, and if anything his advantage there seems to have increased under the new starting clutch procedure, even at an age when his raw reaction times should be beginning to slow.

Alonso gained an average of 2.25 positions on the first lap in 2016, compared to 0.38 positions for Button. Button spent the rest of the race making up for this difference, while Alonso was more often defending his position against quicker cars behind. Alonso remained an average of 1.6 positions ahead of his teammate at the finish.
If we are to find fault in Alonso’s season, it would have to be his performances on days when McLaren were uncompetitive. When McLaren were in the hunt for points, Alonso’s driving was fierce and sublime, but on other days he seemed frankly less inspired. This is reflected in the disparity between the Alonso-Button points tallies and race result tallies. Button beat Alonso five times, but only finished in the points on one of those occasions (Germany).
Next year, Alonso will face a fresh challenge in his new teammate Stoffel Vandoorne. Based on my junior career metrics, Vandoorne is one of the most promising drivers to ever join Formula 1 and the highest rated junior to debut since Jules Bianchi. Vandoorne will be facing one of the toughest possible challenges as a rookie — see how Alonso’s last rookie teammates Piquet Jr. and Grosjean fared. On the other hand, Alonso must surely remember painfully that he was equaled the last time he faced a very highly-rated rookie at McLaren. It’s not out of the question that 2017 will be Alonso’s last season. If so, he will surely want to finish on a high.

You don’t know how much I was looking forward to this article! 🙂
Thank you, it is amazing reading as always.
I have simple question – with comparing Lewis with Nico how can you now compare Michael tally through 2010-12 with his “normal age seasons” and with Lewis seasons from 10 to 2012?
Thank you!
Few more questions:
1. Can you retrospectively count ppr for Sainz and Verstapen for 2015?
2. Do you think it is possible to post all ppr for all drivers for say from 2010 to 2013? 🙂 It would be hugely interesting reading I think!
Thanks!
I’m so happy to see this post! It’s really informative, but I’d like to comment on a few things.
First of all, I really like the tire wear graph in Grosjean’s section, which shows how tire wear can vary from driver to driver. Apparently that weekend he’d found the tire’s sweet spot in terms of set-up or driving style, as he was really fast (close to the Red Bulls and Toro Rossos). Most of his weekends were, however, underwhelming and he was outpaced by Gutiérrez quite often. Back in 2014, this model blamed the drivers (Gutiérrez and Sutil) for Sauber’s dismal season and therefore I was really curious to find out how Gutiérrez would perform against Grosjean. In terms of raw pace Gutiérrez was surprisingly close. Gutiérrez’s main problem is that he performs at a rather constant (but probably rather low) level. Maybe in a top car his performance would have been alright, but in a mediocre car he isn’t good enough to score points. Having said that, he was a bit unlucky to retire in the first races when the car was more competitive.
Bad luck is maybe also the reason why Hülkenberg is rated so lowly. He had unlucky strategies at Monaco and Silverstone, while he got a puncture in Brazil at the worst possible moment. I think Hülkenberg and Pérez are very close in terms of performance and I think they’re both a bit underrated by the model. Pérez probably suffers from a rather underwhelming 2013 season, when he was outscored by Button. After his breakthrough year 2012, Pérez was rather crash-prone in 2013 and 2014, which probably make him look worse than he is. Is it possible to rank drivers based on their performances in races where they didn’t crash out, so you can estimate how much their performance suffers from crashes? The number of self-inflicted DNFs may vary more from season to season than outright race pace (see, for example Hamilton in 2011 and Massa in 2014), so it might even be a better metric for evaluating driver performances. Anyway, as Pérez and Hülkenberg were teamed up with a possibly underrated driver, they couldn’t really improve their rating in the model. Luckily they will have new teammates next year, so time will tell if their ratings were accurate or not.
Hamilton was also a bit unlucky this year, although his poor starts were indeed part of the reason why he lost the title. In Australia, Italy and Japan he lost a lot of places in the run to the first corner, while Rosberg lost a lot of places in Malaysia, when Vettel ran into him. On average they lost roughly the same number of places at the start, but the effect was different: losing a bunch of places on multiple occasions is worse than dropping to the back of the field once, especially as Hamilton lost those places on tracks where overtaking is hard (Albert Park, Suzuka). It’s interesting that the Mercedes drivers were only 6th and 7th in the model, while the team bosses ranked them 1st and 3rd. Apart from Hamilton’s grid penalties there is no good reason why the Mercedes drivers should have been underrated by the model.
I do agree with the model that Alonso was the best driver of the season. His performances were usually outstanding and he delivered a lot of very strong results, especially during the second half of the season, where he was much better than Button. One question: what is the baseline for the pprs? The 2013 Red Bull, or the 2015 Mercedes?
I think when looking at the Mercedes drivers’ rankings, it’s important to note how closely everyone from 2nd to 7th was rated. They could all be considered practically tied, within any reasonable error estimates.
Regarding the reference car, it is indeed the 2013 Red Bull.
The drivers’ names are swapped on the chart at the beginning of Pérez’s section.
Like always a very interesting and entertaining read, thanks a lot.
[…] Rosberg (wereldkampioen met 385 punten, ppr: 6,66*) Berekenend. Heel erg berekenend. Een ander woord is er niet te bedenken voor de manier […]
Do you know if rankings correlate with car performance at all? There is a saying that good drivers end up in better cars. From this year’s results it appears to be somewhat true (purely by looking at the results by eye at least). Is it possible to see if it’s true? (Either this year or in history). Btw I understand that having a good car doesn’t boost their ranking.
Very low points this season in general, Alonso is 1st having less ppr than last year and lowest since 2007. Maybe he’s past his peak but the rest of the grid is even worse.
Interesting to see Lewis and Nico 6th and 7th. I think Mercedes should pick Sainz for the 2nd seat, it should be a good choice.
I’ve been looking forward to this post all year, I always find your posts balanced and informative. Very timely information for Toto Wolff, who I expect will be on the phone to Carlos Sainz!
I think Vettel has had a bad year, he only perform marginally better than Kimi, when Kimi is in the twilight years of his career. Brundle believes that Vettel had lost his mojo and Arrivabene’s support for Vettel seems guarded. So I’m surprised to see him ranked ahead of both Mercedes drivers.
I know you have mentioned adding age to the model, it would be interesting to see how that would effect Vettel who has had older teammates for most of career.
I also find it odd that despite Hamilton being statistically (in terms of wins and poles) one of the greatest drivers ever he is always ranked comparatively lowly in these models. Even the one year he competed against Alonso in the same team doesn’t seem to have enhanced his ranking. It’s seems that by being in the best car for long periods during his career Hamilton has been penalised by the model where as conversely being in average cars for long periods during his career seems to have enhanced Alonso’s ranking.
One thing that I don’t think you have ever mentioned before is that the margins of superiority that a driver can achieve over their team mate in a poor car are far bigger than in good car. Also in a good car more often than not the only way is backwards so for example this year Rosberg didn’t have many opportunities to make up 10 places on the first lap where as Alonso had plenty.
Lastly I think there should be some emphasis given to wet weather performances, drivers such as Schumacher, Senna, Vettel, Lewis, Button and Verstappen have all given stand out performances in the wet.
Once again thanks, I look forward to reading your thoughts on pre season testing.
“One thing that I don’t think you have ever mentioned before is that the margins of superiority that a driver can achieve over their team mate in a poor car are far bigger than in good car. ”
I think this point is arguable. If we are talking in terms of time differences between drivers, I don’t necessarily agree, and you would need to be careful in how you define a “good car” vs. a “bad car”. A backmarker car from some seasons (e.g., 2004) could of course be both faster and easier to drive than a winning car from some other seasons.
If we are talking in terms of point differences, I agree with your point. There is a potential ceiling effect when teams are very dominant and usually finishing 1-2. There is also a potential floor effect when teams are very low performers and points are nearly impossible. Check out the simulations of car performance and teammate success rate I did in the 2014 end of year review for a clear demonstration of this — the conclusion was that it’s easiest for a superior teammate to outscore their teammate in a middle performance team.
Note that the model does account for this, at least qualitatively, because the performance metric involves a sigmoid function, meaning the same performance difference between drivers corresponds to a larger difference in points scoring rate for middle performance teams than for those that are extremely dominant or extremely poor.
Well, it was clear that Alonso would finish 1st in your model once again, given the history of the model and the points separation between he and Button this year. I don’t think Alonso had a great year to be honest. He had a lot of uncharacteristic spins (GBR, BRA, Q3 HUN) that luckily didn’t result in crashes but that cost him important positions in those races. Can’t have those in a title fight.
Again the problem is having only two drivers per team. If both drivers have career years, or both are dismal and don’t get the results the car deserves, then it’s a case of those drivers masking each other from their wider competition. Case in point is Vettel being higher than both Mercedes drivers. Vettel had a pretty poor year. Hard to tell about Kimi … he was better than 2015, and much better than 2014, but how much better than 2015? Was it more a case of Vettel slinking back, or Kimi rising to meet Seb halfway?
To succeed in this model, a driver needs a no. 2 to beat up on regularly. The echoes of those periods is large.
Yeah, I think the model works well over a career, but over a season it is significantly limited by the fact that each driver is only compared against one other driver. This is especially true if a team keeps the same drivers for a few years.
Thanks a lot again for this insight in 2016 season.
For those commenting on the model: please read all the explanation already writen in the blog before commenting. Secondly, when criticizing a model at least you need to suggest alternatives. The model is the most unbiased way so far of analyzing F1 results, and in order to make upgrades which are not based on unreliable assumptions a lot of analysis has to be performed before.
Again, read all the posts which explain the model before commenting on it. Read also the scientific publications on it.
Hi,
For me, the result of Ricciardo and Verstappen does not correspond to the differential between teammates, which is what basically what tries to elucidate the model.
I think the problem is that when analyzing cross references between drivers, it is sometimes done with very few gp’s. Three races is not decisive to know the superiority one driver over another.
Thus, if we eliminate the result of the first three races between Ricciardo, Kvyat, Sainz, and Verstappen, we should see a very different result in the rankings.
On the other hand, it is clear that there is a subjective part in the analysis. That is, the elements that are collected to make the valuations. For example, exactly what I say above: how many races could be valid to determine that one pilot has been better than another ?.
But I have a slightly different point of view as to which races to rate. Why not also assess who went ahead, each time there is a DNF ?. It is clear that we go too far into the subjective, but in the case of some drivers it would be fairer. For example: Alonso often goes ahead of Button, if one of the two has a DNF. I think it would be very difficult for another driver to overtake Alonso on track, except for very specific moments. Therefore, we could assume, that Alonso would finish ahead even more times than his partner than those indicated without counting the DNF.
Ok, that’s just my point of view.
Note that all data in the model are weighted in proportion to the number of counting races for each driver at that team in that season. Not all teammate pairings are therefore equally weighted.
As a reader with old blog name (secreteyes4), it’s interesting how I penned a ranking list (not using your formula, just a random drop of the hat guess) quite similar to yours.
My 2016 ranking is as follows:
Verstappen (1) 8.5
Alonso (2) 8.5
Rosberg (3) 8.0
Sainz (4) 8.0
Hamilton (5) 8.0
Ricciardo (6) 7.5
Vettel (7) 7.5
Raikkonen (8) 7.5
Perez (9) 7.5
Bottas (10) 7.0
Grosjean (11) 7.0
Nasr (12) 6.5
Massa (13) 6.5
Button (14) 6.0
Hulkenberg (15) 6.0
Wehrlein (16) 5.5
Ericsson (17) 5.0
Magnussen (18) 4.5
Kyvat (19) 4.5
Palmer (20) 4.0
Gutierrez (21) 3.5
NOT RANKED: Ocon, Haryanto & Vandoorne
My teams’ ranking:
1 MERCEDES 10.0
2 RED BULL 9.0
3 FORCE INDIA 8.5
4 TORO ROSSO 8.0
5 MCLAREN HONDA 7.5
6 HAAS 7.0
7 WILLIAMS 6.5
8 RENAULT 5.5
9 MANOR 5.0
10 SAUBER 4.0
11 FERRARI 3.5
Great analysis as always.
Why would ferrari fall so behind? It was clearly the 3rd strength of 2.016 and sometimes beat red bull on track for 2nd place even. Even if you want to say they performed badly relatively to the budget they had, keep in mind their budget is very similar to red bull, force india would be the exploit since they have so few money; on that regard I don’t get how mclaren would’ve done better than ferrari since they’re rich too.
I wasn’t using F1Metrics’ formula; it was my hyperbolic way of expressing how bad Ferrari’s season was. The car progressively became slower, reliability remained as bad as 2015 and no other team failed at pit strategy as much as Ferrari did. So they deserved last and I will write about it soon.
Nasr was outperformed all this year and second half of last year. He had one lucky freak race in brazil. Don’t actually get it.
This is bullshit, Ricciardo finishes behind Vettel, Most of the results seem incredibly objective
[…] della prestazione dei piloti e non della qualità delle loro monoposto? Il blog F1Metrics (leggi l’articolo) ci ha provato e in base all’algoritmo di calcolo elaborato, la classifica del Mondiale 2016 […]
What about the best teams?
Here are the model’s points estimates for each team in 2016 assuming equal drivers:
1. Mercedes 708
2. Red Bull 401
3. Ferrari 327
4. Force India 247
5. Williams 180
6. Haas 118
7. Renault 52
8. Toro Rosso 37
9. McLaren 37
10. Sauber 7
= Manor 7* (assuming Sauber=Manor)
[…] El estudio es un profundo análisis del trabajo de cada piloto en las 21 carreras que han conformado esta temporada, pero sin tener en cuenta los monoplazas, a día de hoy, más que importantes en la máxima categoría. El objetivo es ver el rendimiento real de cada piloto. Con los datos de 2016, Alonso figura en la primera posición, seguido de Max Verstappen y una sorprendente tercera posición de Carlos Sainz. Mientras que Lewis Hamilton aparece en la sexta plaza y Nico Rosberg en la séptima. Tras conocer este estudio, tanto Alonso como Sainz bromearon a través de las redes sociales. […]
Great article !,greetings from Patagonia Argentina.
Love the analysis – but I would second the call for a breakdown of team’s performance (I know that the model has calculated this already…) Which were the second, third &c. best cars? How much had McLaren actually improved? Where would the Mercedes have finished if they were driven by Haryanto and Gutierrez?
[…] been near the top of a number of “Drivers of the Season” lists (both qualitative and quantitative), so it shouldn’t be a surprise that he is also near the top here. He made the most of […]
Please can you write a blog giving us an update to the overall rankings? I’d absolutely love to see how the current top drivers have moved relative to each other!
Thanks for the analysis.
Can you tell me how much weight is given to the results of the previous year in terms of assessing the performance levels? I am wondering if this has a boost for certain drivers who may have a decent year but lose to a strong teammate – like Button for instance. And Nasr is definitely buoyed by last year’s performance so both he and Ericsson get a decent score whereas I think Grosjean is hurt by this year’s teammate and what was really a better drive for him than many give credit for is a full 1.27 points lower than the 2014 season where he had 2 points finishes.
Another point I would add to your comments on Ricciardo, Verstappen, Kvyat, and Sainz would be the Russian GP too where Kvyat hit Vettel who hit Ricciardo. Ricciardo finished 11th there. Vettel was a DNF. Ricciardo outperformed Vettel for most of the season without the actual driver issues of the latter. Yet Ricciardo is a 6.96 and Vettel a 7.21. With a switch DNF for Ricciardo and 11th for Vettel in Russia would there be any change? I feel your model gives the benefit to drivers & teams that do not keep going if they are running poorly in a race – example if a car is down on power as a few teams have done – ending a race for precautionary reasons that hurts much less than if they keep going and finish 11th or higher.
Most people you ask would say that Perez was considerably improved over 2015, Force India, media, many statistical people. He finished 7th in the championship ahead of both Williams but somehow is 5.57 this year vs 5.87 last year and below Bottas’ 6.13 which was almost the same as his finish in 2015? Did you count the 17th in Austria due to brake failure as a standard finish or man related error? If you take that out does he vault up at least over his performance last year?
In 2016, Hulk managed 72 points to 101 for Perez. Perez had no DNFs but the 17th in Austria was a late brake failure that some called an ‘accident’. I don’t see how your model considers 2015 a better season by 0.30 PPR for Perez despite 1 more podium than last year, more than 100 points and not blatantly throwing away races like Canada in 2014. Does that 16th place in Bahrain also hurt Checo? What if that was a mechanical DNF too – say the damage from the first lap incident was just too much? Does he go up or is he still held back by poor performances in his past in 2013 and relatively in 2014?
The model fits all seasons of data simultaneously for all drivers and all teams from 1950-2016. This means that all results contribute to the model’s estimate of each driver’s performance in each year.
Perez’s brake failure in Austria was counted as a non-driver DNF.
We need to be careful in directly comparing ppr values between seasons, because it is not an absolute scale. It’s the model’s estimate of the points per race the driver would have scored in the 2013 Red Bull. However, as each season of new data comes in, the model’s estimate of how good the 2013 Red Bull can also slightly change. In retrospect, I should perhaps have chosen a fixed reference. Each added year of data of course also updates the model’s estimates of driver performances in past years, e.g., the model becomes more and more confident that neither Perez nor Hulkenberg are really top drawer.
[…] belangrijk het is om niet te snel en niet te traag van start te gaan, liet Grosjean dit jaar in de Grand Prix van Bahrein zien. Hij reed zijn Haas naar een knappe vijfde plaats in de […]
Any chance you could post the overall updated rankings of people now that a few more have 3 year peaks, as well as updated rankings for some of the others? Would be interesting to see where Hamilton, Rosberg, Raikkonen and Button rank now (Alonso is presumably unchanged), as well as new “elite” drivers like Ricciardo and Bottas.
Great read! Thanks!
[…] thing is, I’m actually convinced by the thoughtful evidence that crowns Alonso as the best individual driver currently on the grid. Only one problem: there is […]
So a rookie who beat Alonso is rated five places behind? Interesting.
Correct, when the model considers all of their career results. However, as I’ve noted in a few places, the model published doesn’t yet include age or experience effects. A new model that includes these factors is almost complete.
In Hamilton’s case, I think it will be very interesting. His rating in the published model is certainly hurt by his rookie status in 2007 being overlooked. But Hamilton is helped rather a lot by the indirect Schumacher-Rosberg comparison, which did not accout for Schumacher’s age and therefore inflated the rating of one of Hamilton’s main teammates. Excluding Schumacher’s results from 2010-2012 drags down both Rosberg and Hamilton in the rankings.
[…] Before going into this analysis, it’s important to note that car failure rates have varied over the course of Formula 1 history. To explore this, I used my database of Formula 1 race results, in which I have previously coded all DNFs as either driver DNFs (e.g., crashes) or non-driver DNFs (e.g., engine failures). This is the same database I use for my model-based driver rankings and update annually for my end of season performance rankings. […]
Have you tried to put some data from other races into your model? e.g.2014-15 formula E results is quite helpful to make a good estimation of a few toro rosso drivers in the past years. e.g. in which Vergne who is massively overrated in your method(due to sample size) is soundly beaten.
I haven’t yet, but I am keen to look at other classes of racing. I probably wouldn’t try to combine the datasets directly, since the demands of Formula E and Formula 1 are so very different that we wouldn’t expect a top driver in one to necessarily also be in the other.
Impatiently waiting for 2017 rankings, could You give a hint when will it happen? 🙂
Sorry for the long wait, I did a lot of extra analyses this year, so it took a bit of time!
Will there also be a post on the 2017 driver rankings?
[…] in previous years (links for each year: 2014, 2015, 2016), the focus of this article is separating team from driver performances to provide a quantitative […]
[…] y en ocasiones su velocidad punta ha rozado el esperpento, por no hablar de la fiabilidad. Un análisis matemático le puso como mejor piloto del 2016, y el tercero de este año (claro que es el mismo modelo que […]
[…] it should be noted that he was rated the worst performing driver in F1 by my model twice before losing his seat […]
[…] of approximate age and experience curves, see my previous end-of-year articles for 2015 and 2016, respectively. In other words, the model doesn’t attempt to estimate individual differences […]
[…] 2016 model-based driver rankings […]
Can you make one of this for 2007 season?
Alonso and Hamilton were so close that I can’t hardly differ one from another. I even tried to apply the new point system (25-18-15-etc…) to the old one, and Alonso came on top of Lewis, I tried with the fastest laps, I tried with their personal best laps of the races. The only certain win (close but certain) it’s raw pace from Lewis, he did got one more podium, but something’s just not right.
the model will put Alonso on top–it always does
This is not correct. Hamilton is rated 1st in 2007.
2020 rankings wen??