With less than a week until the 2019 cars hit the track in Melbourne, let’s take a careful look at the preseason testing data and what we can expect from the latest driver match-ups. Owing to time constraints, you have my apologies for this coming a little later than usual. Hopefully better late than never!
Preseason testing
In past years, I have used a method to analyze long runs from testing that has proven to be quite accurate for predicting the within-in season pecking order. You can find this method described in detail is last year’s preseason analysis post. To briefly summarize the steps:
- I collected stints that were known to be part of a race simulation. Since these stints were strung together by pit-stops only for tyre changes and typically ran close to a full race distance, the fuel loads are known. These stints can be used to anchor the data for stints run at unknown fuel loads. For comparing stints, I estimated the equivalent pace on a full fuel load (70 laps of fuel).
- I collected all other long runs for which the tyre compound was known. Stints were cleaned of slow laps (>1 sec/lap slower than laps on either side). I required a minimum of 10 laps with valid times for inclusion in the analysis.
- I derived degradation-time curves for each team on each tyre compound. These curves show the relationship between lap time and how hard a driver is pushing (i.e., degrading the tyre compound, as evidenced by worsening lap times). This step is critical, as it allows comparison of stints with variable work rates of tyre compounds. This is the step that is missing from all other online analyses I have found; without it, one may be comparing a stint where a driver was pushing very hard to one where a driver was extracting very little life from the tyres.
- Finally, I attempt to estimate the unknown fuel loads by finding estimates that give the best match to the degradation-time curves for each team.
Of course, even after all this, we may still be comparing cars with differing set-ups, track conditions, and engine modes. But by compiling enough stints, we can hopefully begin to divine the overall trends, and spot outliers. It’s not perfect, but it’s about the best we can do as outsiders, without access the teams’ internal data.
As in previous years, @f1debrief on twitter was a superb resource for collecting key long runs in 2019 preseason testing. This year I also had considerable help from a colleague in collating the data from the live timing, without which I would not have had time to complete the analysis before the first race.
Overall trends

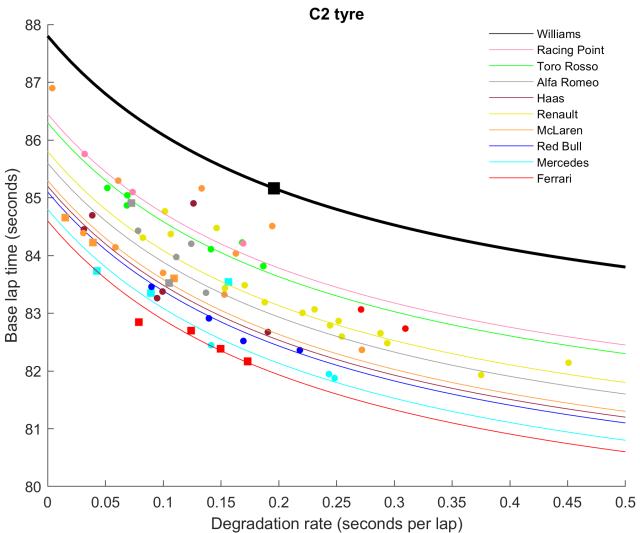
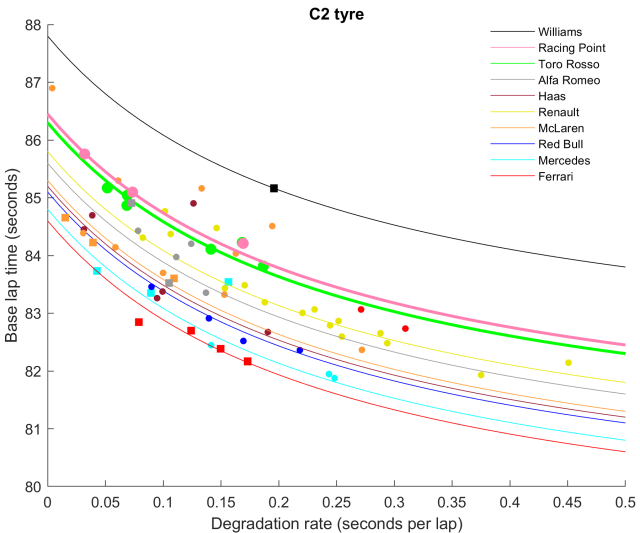
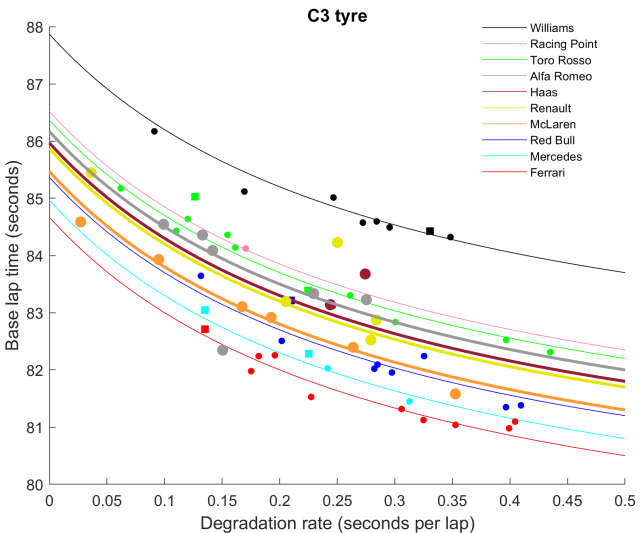
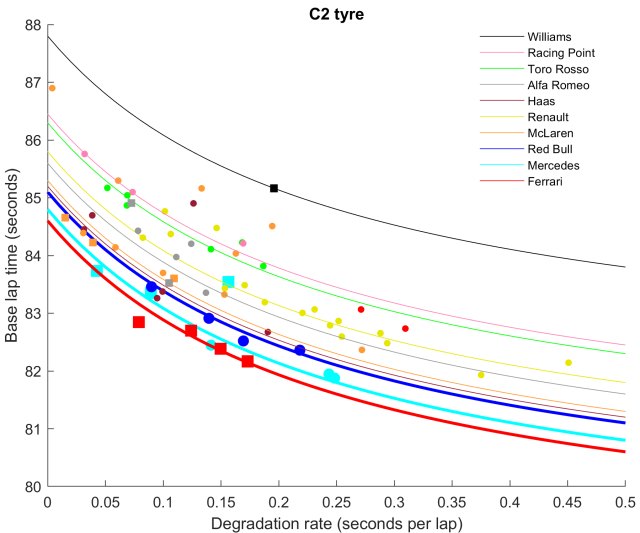
Below, I have plotted the degradation-time curves for the two most used compounds in testing: the C3 compound (softer) and the C2 compound (harder). Note that, given the huge changes in the Mercedes design from the first to second test, I used only their second test data, which was still a reasonably sized dataset.
To read these graphs, the x-axis represents the rate of tyre degradation (in seconds per lap, after adjusting for fuel burn), while the y-axis represents the base lap time (i.e., the predicted lap time on a fresh set of tyres) after adjusting for the estimated fuel load. Note that curves always slope down, meaning that the harder a driver pushes, the lower (faster) the base lap time and the higher the degradation rate. The curves for different teams have different vertical offsets, representing differences in their base lap times on a particular compound. These offsets represent differences in pace between the teams, which are discussed and analyzed in detail for each team below.
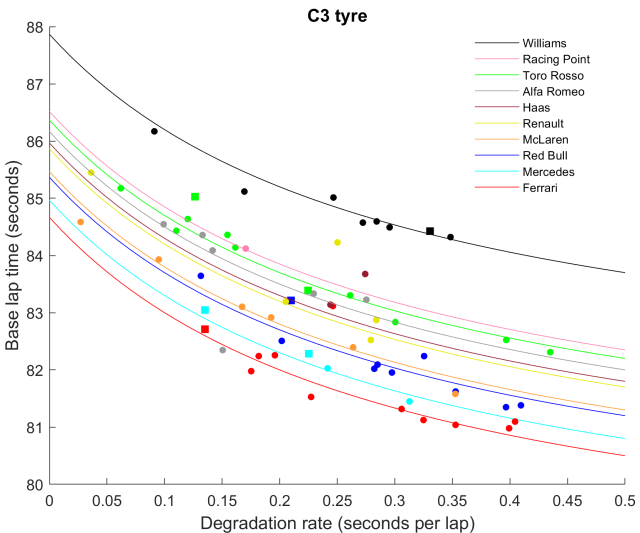

Degradation-time curves for each team. Colors for each team are defined in the legend. Lines represent best-fitted curves for each team. Individual points represents individual long runs (at least 10 valid lap times after cleaning). Stints from race simulations are plotted as large squares. Stints with unknown, deduced fuel loads are plotted as small circles. All y-axis values correspond to estimated pace on a full fuel load (70 laps of fuel).
Let us now run through the individual teams, their performance estimates, and the potential sources of uncertainty in these estimates.
Williams: Clearly struggling

There is unfortunately very little positive to be said about Williams’ performance at this stage. They came into preseason testing with difficulties and delays, before parting ways with their technical director, Paddy Lowe. They are likely also feeling the ramifications of the Stroll family money shifting over to Racing Point. The 2018 season was a tough one for Williams, and 2019 is looking like it might be even tougher.

On the basis of their race simulations and other stints, Williams appear to be currently 3.2 seconds adrift of the leaders and over a second adrift of the next slowest team. Williams will hopefully make some developments in the early season to catch up, but for now it’s looking like it could be a back-row lock-out in Australia.
The lower midfield

Getting into the midfield, we can expect some intense inter-team battles this year. By my estimates, the 5th through to 9th best teams are spanned by ~0.7 seconds. Looking at the slower end of this range, we have Racing Point and Toro Rosso. The differences between these two teams and others are small enough that this hierarchy could be largely track dependent. As I noted last season, what was quickest at Catalunya was not necessarily quickest at other circuits. They are clearly within potential fighting distance of other teams, so I expect these teams to battle their way into the points.
In the case of Toro Rosso, we have a couple of confirmed race stints on the C3 tyre to reliably place them around 1.7 seconds slower than Ferrari. In the case of Racing Point, there is less to go on, but based on plausible fuel loads they appear to be somewhere in the same range; I estimate 1.9 seconds slower than Ferrari with their current package.
The upper midfield

Team ranks 4th through 7th look like they will be fiercely fought in 2019. These four teams in particular show the importance of gathering a large dataset to examine trends. If we base the whole analysis on only one unrepresentative stint, we can potentially come to extreme conclusions, which may explain the diversity of team rankings in the midfield across other websites.
Renault completed impressive mileage, but none of their long runs were confirmed race simulations, making it difficult to anchor their fuel loads. Their longer runs were almost always punctuated by stops in the garage for minutes or longer, meaning they may not have been running at race stint fuel loads. I found that the best fit to most of the stints, adjusting for likely fuel loads, put them consistently 0.8-1.2 seconds behind Ferrari across both the C2 and C3 compounds. But I acknowledge that this is an uncertain estimate for now. In their analysis of preseason testing, AMuS concluded that Renault are currently 2nd best, between Ferrari (1st) and Mercedes (3rd). If this were the case, Ricciardo would actually be looking at an upgrade from Red Bull! Examining the data, however, I find this difficult to reconcile with the slower pace of several of Renault’s longer runs, including one on day 6.
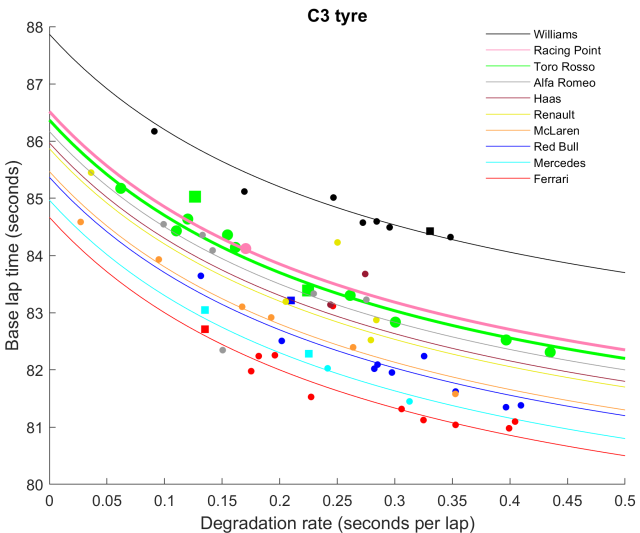
Alfa Romeo are another difficult case to judge. Overall, most of their runs appear to put them around 1.0-1.5 seconds behind Ferrari. However, they had at least one very impressive stint on the C3 compound, which appears on the red Ferrari curve in the C3 graph above. Here are the individual lap times for this particular stint:
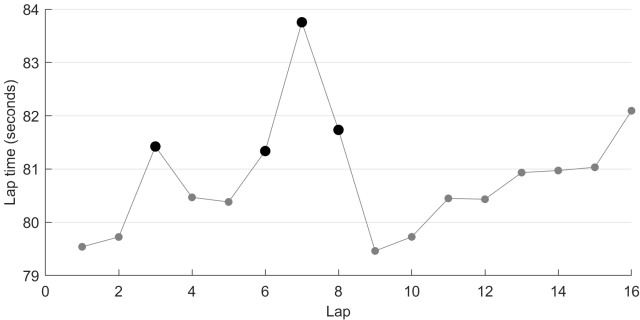
We can see that, although most of the stint was indeed very fast, there was a notable three-lap slow period in the middle. These lap times were cleaned out of the stint in my analysis (exclusion denoted by black dots). This slower period would have allowed the driver to regain battery charge and lower temperatures, enabling a subsequent period of faster laps, possibly in a higher engine mode. Rather than a typical race stint, this may be a simulation of the type of running needed to pull a gap in a critical phase of the race, or just testing out system tolerances. To me, it doesn’t look like a representative race stint, explaining why it is such an outlier.
For Haas, we see a considerable variation in lap times between the tyre compounds. Like for Alfa Romeo, we can see some very impressive times, this time on the C2 compound. Let’s take a look at the quickest C2 stint:

Note that, unlike the Alfa Romeo stint, this one is extremely stable and fast, with a base lap time at the beginning of the stint of around 80.9 seconds. This looks much more like a representative race stint, given its consistency and length. Given the stint ran for 25 laps, the least generous interpretation is that the car was fueled for only 25 laps. An equivalent pace on 70 laps of fuel at Catalunya is about 2.4 seconds slower, meaning a fuel-adjusted base lap time of 80.9+2.4=83.3 seconds. The degradation rate (fuel-corrected slope) is only 0.09 seconds per lap, which places this stint only a few tenths slower than Ferrari on equivalent race stints. If we look at this stint alone, Haas are possibly challenging Red Bull.
We must, however, somehow reconcile this with the pace of the C3 stints, which, even under the most generous interpretation for fuel loads to Haas, were 1.4 seconds adrift of Ferrari. The performance of the Haas machine is therefore one of the most intriguing questions going into the season. If they are only able to extract maximum performance on the harder tyre compounds then we may see them shine brilliantly at certain tracks and struggle at others. Haas appear to have an interesting concept, at the very least.
Finally, what to make of McLaren, who have been ranked everywhere from 3rd quickest to 9th quickest. Have they bounced back from last year’s very difficult season, where they were at times slower than Williams? Looking at their race simulations on the C2 tyre, they certainly look more competitive this year than last year. If we use those stints to anchor the other stints of unknown fuel load, we see that McLaren are usually trailing Ferrari by about 0.7 seconds. There are, however, four stints on the C2 tyre that are much slower — over a second slower than this. Which are the more representative stints? The quick ones, which place McLaren at the pointy end of midfield, or the slow ones, which place McLaren down in lower midfield? McLaren’s running on the C3 tyre is consistent with either interpretation, and unfortunately we have no C3 race simulations.
Some important insight is gained by comparing McLaren’s performance in the first test to their performance in the second test.

We can see from this that all of McLaren’s slower stints, and much of their variability, came from the first test. Once they had everything checked and functioning, McLaren’s pace was consistent and more impressive in the second test. These results suggest that McLaren should be capably fighting in the upper midfield this season.
The top three
Last year, Formula 1 was functionally divided into two competitive classes: F1 (Mercedes, Ferrari, and Red Bull), and “F1.5” (everyone else). This year, it looks to me as though the gap between these classes has reduced, blurring the lines between them. Red Bull in particular may be under threat from teams in the upper midfield, although their pace was quite difficult to pin down due to Gasly’s crash early into his race simulation, not to mention their need to experiment with a new powerunit.

At the top of the pile, Ferrari and Mercedes look again to be emerging as the key championship competitors. Last year, I concluded Mercedes had the edge coming out of preseason testing. This year, I have to say that Ferrari look strongest of the pair. On comparable C3 stints, we see Ferrari leading Mercedes by about 0.3 seconds. On the C2 stints, the gap is about half of that.
Below, I have plotted the lap times from the two closest comparison stints between Ferrari and Mercedes. The Mercedes stint was a simulated first race stint started by Bottas around 2pm on day 7. The Ferrari stint was a simulated first race stint started by Vettel around 2:30pm on day 8. The two stints were therefore under near identical conditions.
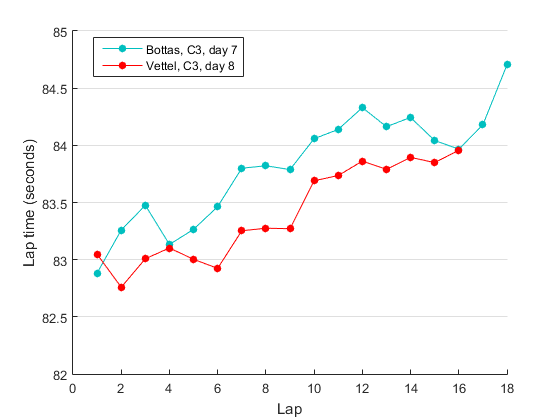
Across laps 1-16, the Ferrari averaged 0.3 seconds faster than the Mercedes. This is a competitive gap that a driver could potentially bridge, though with difficulty. Mercedes have a development battle ahead of them, but they have proven themselves very capable in this regard in past seasons.
To summarize the above data, here is a graphic showing the estimated gaps to the front for each team, given the best fitted curves and associated degree of uncertainty.
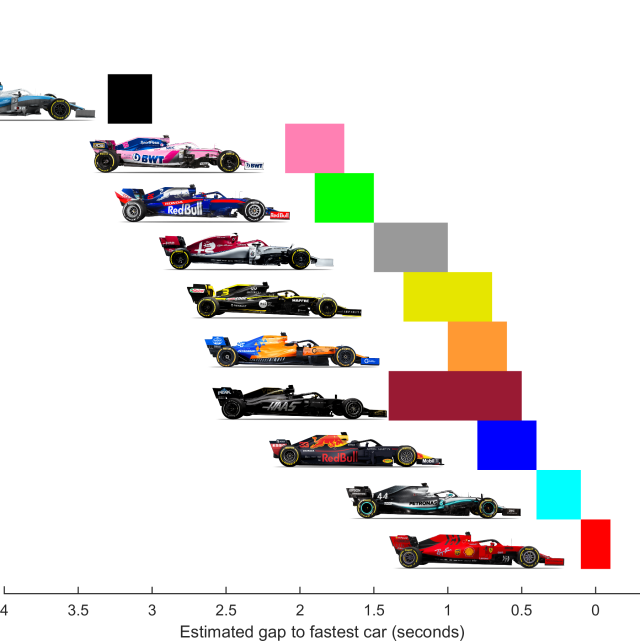
Colored blocks represent ranges of uncertainty for each team.
Intra-team battles
One of the fascinating things about the 2019 season is the number of new driver teammate pairings. Of the ten teams, only Mercedes and Haas are running the same driver line-ups in 2019 as in 2018. This season will therefore be a fantastic opportunity to better understand the driver hierarchy in F1 today.
Before we see the results of those match-ups, let’s ask my driver performance model what it predicts. For each match-up, the model takes into account the drivers current age and prior F1 experience. The model also takes variance into account, generating probabilistic estimates, with the answer representing the percentage likelihood that the driver will have higher points per counting race (excluding mechanical DNFs) than their teammate across the season.
Whereas last year I simply gave no predictions for rookies, this year I’ve used an approach to estimate each rookie’s probable performance. Specifically, I searched for other drivers with similar rookie age (within 5 years), and similar scores on my junior career metrics of achievement (within 30 points) and excitement (within 5 points). I then used their performances to generate a proxy distribution of performances, applying the appropriate corrections for age and experience to match the actual rookie in 2019.

Let’s start with a controversial prediction! Given his meteoric first season, the model sees Leclerc (with the benefit of additional age and experience) potentially being more than a match for Vettel, with an almost 2 in 3 chance of coming out ahead. I’m personally more circumspect, as I think Ericsson’s uncertain rating may have inflated Leclerc’s status, as I noted last year. In any case, this will be a fascinating match-up.

Hamilton has looked firmly in control at Mercedes since Bottas joined the team. The model sees that scenario as being very likely to continue.

Gasly showed serious promise in 2018. However, facing Verstappen is a tall order for any driver, especially given he is clearly the favored driver within the Red Bull team. The model sees Gasly having about a 1 in 5 chance of outperforming Verstappen in 2019.

The Magnussen vs. Grosjean battle will continue into a third consecutive season at Haas. Grosjean still seems the quicker driver when on form, but his erratic performances across a season tend to always cost significant points. The model sees Magnussen as the slight favorite here.

This is the most one-sided prediction on the grid. There are two factors contributing to this: (i) although the model’s ranking of Sainz was downgraded last season, it still remains relatively high; (ii) historically, rookies are very unlikely to outscore their teammates. Norris, who was a very talented junior, surely rates his chances higher than this.

This one is surely the most mouthwatering new pairing on the grid. How does Hulkenberg measure up to Ricciardo, a driver who has a strong claim to being among the sport’s elite? As the model sees it, this one could easily go either way!

Experience vs. youth should make for an intriguing battle at Alfa Romeo. The model views Raikkonen as the favorite, with a 1 in 4 chance of Giovinazzi prevailing over Raikkonen.

Albon and Kvyat are both receiving recalls from the Red Bull program to drive at Toro Rosso. Kvyat has more F1 experience and undoubtedly the better junior career, but has he mentally recovered from his previous demotion and sacking? If he has, expect Kvyat to take the lead at Toro Rosso.

The experienced and very capable Perez is likely to give Stroll a much sterner test than Sirotkin did last year. The model sees Stroll as having a 1 in 3 chance of outperforming Perez; that number is probably inflated due to Stroll’s large rating gain from the result of Baku 2017, as I noted last year. Perez is surely the favorite in this one and the match-up should help to clarify Stroll’s actual level.

Kubica, on comeback, will face Russell, the reigning F2 champion. Under the model’s assumption of no effect of Kubica’s injury, it sees Kubica’s age and talent counting for enough to come out ahead. In reality, we will have to see if the injury matters.
And with that, I wish you an enjoyable 2019 season!

The best read post any F1 test. Literally completely ignored all the other predictions spiels that have come out of testing. So comprehensive in every aspect. Thank you very much.
Thanks for the analysis once again. Definitely the best out there. Do you play F1 Fantasy League by any chance?
Thanks, great rundown as always. If the AMUS rankings come true and Renault are fighting Ferrari for the title I’ll eat my hat. Although I agree the midfield seem closer to the top 3, I suspect like last year that gap will extend over the season as in-season development kicks in.
AMuS said Renault was 2nd?!? That’s nuts. Seems to me that Ferrari have enhanced their engine quite a bit, and on the electrical side, as they seem to pile on the power early on, on any straights, with no wheelspin. It gets them to top speed earlier, so gains them good chunks of time. It’s helped Haas as well, even though they’re using last year’s engine.
AndrewM, did you sign up at motorsport.com? I’m still in mourning for the JAonF1 forum … we had a good thing there. The level at MS seriously leaves a lot to be desired. I think I would join Mark Hughes’ forum, or RaceFans, before MS.
I think that you may be mistaken about Haas using the 2018 Ferrari engine. As far as I am aware, Haas are being supplied with the 2019 engine. Can you provide a reference for your assertion?
@KRB – The level on the MS forum is horrific. But it is weirdly entertaining. Not many from JAonF1 have made it over. Agreed that the Mark Hughes page is probably the best in terms of quality, but its a bit slow and small in terms of readership.
Maybe our host here would be a good alternative? The analysis is on another level to anything else in the public domain.
@JoCoco, you’re right, they’re using the 064 engine. I had seen on the 2019 F1 Season wiki page that they were using last year’s engine (061?), but it’s showing as 064 on there now too. I had thought that was a primary reason for their engine troubles during testing.
@redline, yeah from what I saw it wasn’t great. Saw one post from Tealeaf – an old JAonF1 poster not particularly known for insightful comments – celebrating the demise of the “fascist” JAonF1 forum. *smh*
I doubt Andrew here would want to turn F1 forum moderator, as he has a f/t job already. Sometimes quality over quantity is the way to go, which is where this site excels (even if I have nitpicked his methodology at times). So the search for a new home continues …
Looking at the times from testing I think the model is a little out in this Toro Rosso battle. Albon looked impressive pace wise, while the first couple of races might be tough, once he gets back to Europe to tracks he knows well he could well outscore his Russian rival.
1. How do you comment Tost’s reply regarding Ferrari being at least 0.5 seconds ahead to competition and while this might not have any relation to the data used to compile your analysis, looking at the footage of Vettel’s fastest lap alongside Hamilton’s fastest lap I get the feeling that being faster on the last sector means you are generally carrying less fuel. The real question here being that you consider the range of uncertainty between Ferrari and Mercedes to be closer to 0.5 (or above) or closer to 0.15 in Circuit of Catalunya?
Based on what I’ve seen, I think the overall gap (at least at Catalunya) is ~0.3 seconds. It’s muddled a little by different driver comparisons, and it will differ by track too, so a Hamilton pole in Melbourne wouldn’t hugely surprise me, but for now my money would be leaning towards a Ferrari pole.
So by the looks if it red bull would start less competitive than last season, in relation to the other top teams?
Hi, a quick question – does Kubica’s prediction include any kind of discount for him being away from the sport for so many years?
Yes, the model specifically considers the number of seasons a driver has competed in the past four years, so Kubica is coming in as effectively a rookie in that regard.
Thanks for the great article once again. As a small request, would it be possible for you to do a feature article at some point about the top 10 former drivers based on what the model predicts their performance to be if they returned for this/next season? Could format it as “Which former F1 driver would you choose for a new F1 team” or something like that
I love that idea! I’ll try to make it a reality.
It wouldn’t feel right to start a season without this article. Awesome work as always!
Thank you so much for this more than interesting annual analysis. I was waiting for it as much as the 1st Grand Prix is !
From my side, I was expecting Toro Rosso stronger than that but we will see.
Based on the admittedly small and unrepresentative sample size that we get from testing, this is an extremely solid analysis.
I did a small amount of analysis myself after the awful reporting at the major outlets (Autosport), especially saying Mercedes was somehow in dire straits and McLaren was possibly way down in the field. Desperate clickbait. This analysis mirrors my thoughts even using extremely limited datasets, which was to prove the point that even the most cursory analysis disagreed strongly with prevailing coverage.
It’s beyond question that Toro Rosso and Racing Point are back of field in front of Williams. Attempts to put McLaren that far back are emotional and not reflective of test data (McLaren was #11-12 in Melbourne last year, similar to where they show this year, even if they fell apart through the season that’s not what we’re analyzing here). I’d put HAAS and Red Bull with similar size error bars thanks to Red Bull’s limited running. With Red Bull’s bigger error bar, we get the Cinderella scenario of Alfa running close to the top of the midfield. Unlikely but exciting. This analysis also lacks comment on the faster C5 compound, where historically Mercedes struggled to maintain race pace on softer compounds. The important bit is that the Merc equalled Ferrari in one-lap C5 pace, meaning Lewis’ qualifying abilities could put the 2019 aero rules to the test if Ferrari really do maintain this race advantage.
Looks like an exciting season ahead.
Good post as always. Having seen the lap-time data from the winter tests myself for the first time, I was a bit surprised by how messy and seemingly meaningless most stints were. Still you managed to very accurately model the relationship between tire degradation and pace (is it an exponential function, by the way?). Based on Bottas’ and Leclerc’s race simulations it seemed that Ferrari were quicker indeed, but that they had slightly higher degradation, so they were also pushing harder. The lap times seemed to suggest that Bottas ran a more aggressive engine mode at the end of his race simulation on day 7, suggesting that Mercedes can go a little faster.
Regarding the degradation-time function, I’ve assumed a hyperbolic function here and in the past. In tends to give a reasonably good fit to the performance characteristics of the Pirelli tyre. This is purely empirical observation; it would be good to use a more physical model.
Amazing piece. Thoroughly enjoyed reading it. Will be interesting to see just what happens in reality come this weekend!
Your objective and thorough in depth look at the testing data is quite simply the most authoritative source of pre-season F1 analysis available. Thank you!
Reblogged this on AF1@F1.
I like the work you’re doing very much. Since you’ve come up with the driver rating for 2014, the articles are getting clearer, richer and very well structured.
Thanks and keep it up!!!
Finally an analysis that is close to my own analysis (based solely on the data of f1debrief).
Personally I think McLaren is the fourth team. Sainz did a very strong and constant race stint on the C3s, just a couple of tenth of the stint of Mercedes.
And Red Bull is imho closer to Mercedes. Verstappens race stint on wednesday (cut off by his spin) was on par with Mercedes (and only .2s down to Ferrari) up to that point and a lot quicker than Gasly.
Utterly fascinating read as usual, I actually look forward to this blog post year on year. Keep it up. My only variation on the pecking order would be that Haas should drop down 2 places given their large window of uncertainty. Looks like the top 3 will spoil each others race strategies with mclaren interfering with red bulls race strategy.
Great to see this post – you’ve clearly had a lot else going on this off-season!
Fascinating breakdown of the team testing performances. I’m really looking forward to seeing how the midfield plays out this year, and how in-season development affects the balance of power.
Oh – do you foresee a 2018 juniors report, or is that unlikely at this point?
I like to go by the wisdom of the betting markets, which suggest that Vettel is about twice as likely to win the WDC than LeClerc, so I would personally give LeClerc no better than 35-40% chance of beating Vettel. Great overall analysis, though.
Many, many thanks for taking the time to do this. I look forward to your pre-season post almost as much as the first race itself.
Most surprising to me is the Vettel – Leclerc analysis! Looks like an exciting season ahead.
That worked as well as 2017 then.
Agreed. Every prediction was on the money except Ferrari, and there seem to be some good reasons behind that.
Which reasons?
There are a number of rumors, some quite credible, suggesting Ferrari were running in a compromised form in Melbourne. I’m digging into the data to see what I can find there.
It seems 7/10 driver duels were either wrong or on course to be wrong during that race 🙂 And Force India didn’t suck as predicted?
Force India predictions were accurate as far as testing went. They didn’t bring their Melbourne package to preseason testing. As to driver predictions, do we base these on one race now?!
It was just a comment on your wording, not the actual results. You could’ve equally said 40% of the predictions were on the money and been equally right about it.
No, I would say 80% of the predictions that can be assessed at this stage were on the money.
That would ring closer to truth as well. As usual, great analysis, best I could find. Makes me wonder if AMuS’ findings are such as they are only to provoke interest. I am a bit saddened, however, that you’re often needlessly protective in the comment section, and more interesting comments tend to go unanswered.
Do you not feel that you are wasting your time? Your analysis is pretty boring and it usually ends up being incorrect. Your model has numerous flaws to it that can’t really be rectified.
A for effort
D for execution
I’m having fun with it and I have no expectation of your or anyone else’s readership, Todd.
Personally I find the comparisons with reality (right or wrong) quite interesting. If it’s wrong it’s fun to work out why.
Other mathematical F1 models have shown that there are huge potential issues, but that doesn’t mean they were pointless.
F1metrics, your analysis looks spot on so far. Keep up the good work and ignore the knowitalls.
Only way you can have objective analysis is by it being data driven instead of gut feeling driven that most journalists do.
Great post! Finally someone using a scientific approach unlike the usual guesswork… Thank you!
Every once in a while I pop back here and read an article or two. I’m interested to know how the all time rankings are developing and while I’m sure you have issued some updates, I’m having difficulty finding them, either because I’m not looking hard enough or they are buried in other articles. Could you do a short separate post the next time you update them? iI would make it easier to find.
I’m intrigued to know where Verstappen will measure up by the end of the season, his performance in the latter stages of 2018 and the first half of this season suggest he has matured as a driver and it’s going to be fascinating seeing what happens from now if his car remains competitive.
Gasly’s performance has been ‘ghastly’, and interestingly looking back at your analysis of last year your model rather suggested that he wasn’t performing all that well, it’s just that Hartley was so poor he made Gasly look good. Some good drives from Le Clerk, however I’m not convinced by him yet, an underperforming Vettel might have flattered some of his drives, but is the model of another opinion?
I was reading one of your articles on expert vs model rankings and a passing comment reminded me of the music business where an unfortunate early death, particularly at your peak can confer ‘legendary’ status to a musician while others arguably as talented might be considered less reverentially perhaps because of several more recent decades of mediocre output. I wonder if there is a way of examining expert rankings to see if there is an obvious effect of early death on subjective rankings. It’s just a thought, and as the Gilles Villeneuve and Elio De Angelis examples seem to show it may not be a consistent effect as they have two quite opposite outcomes in terms of experts vs model.
Thanks for reading! I’m getting a lot of requests for an updated all-time ranking list, so I’m making it a priority. I’ve been making some improvements to the model in the background, so it’s a question of when I consider it ready to roll out, combined with finding the time to do such an article justice.
I like your (slightly macabre!) idea regarding early deaths. I’ll see if there are enough cases to make anything of it.
If the new ranking ever comes out… *wink* I fear for Jim Clark’s ranking with added age and experience effects. It seems many of his teammates were inexperienced drivers that might have made it seem the cars he drove were worse than they actually were.
I’m eagerly looking forward to your 2020 Analysis. I’ve already reviewed the results from testing (only long stints on various tyre combinations) for each of the top dogs. Unfortunately, there was so much sand-bagging in February that I haven’t been able to reach any concrete conclusions (beyond what most of the pundits are already saying).
Keep up the great work!
[…] the graph below, the bars represent my predictions from the 2019 pre-season analysis. The blue dots represent the lap time data from qualifying, […]