
The ability to shine in wet-weather conditions is highly prized in Formula 1. This is partly because of the increased difficulty for drivers in slippery conditions with poor visibility, and partly because wet weather is considered a leveler of mechanical differences (although there are of course some chassis that are much better suited to wet-weather conditions than others). Legendary drives in the wet are often cited as the greatest driving performances of all time, such as Senna’s drive at Donington 1993, Schumacher’s drive at Catalunya 1996, and that wet qualifying session at Watkins Glen in 1979 when Gilles Villeneuve set the fastest lap by 11 seconds.
After looking around a bit, I didn’t find any detailed analyses of wet-weather driving skills across the history of the sport, so I figured I’d do my own.
 Wet races
In performing any analysis of wet-weather driving skills, it’s first necessary to define what one means by a “wet” race. If it doesn’t rain during the race, but the track is wet at the beginning, is it a wet race? Or what if it only rains in the last two laps? The dryness/wetness of a race could be considered a continuous variable, ranging from totally dry to monsoonal rain. Some drivers may really excel at certain levels of dryness/wetness more than others. Unfortunately, the frequency of wet-weather races is relatively low, meaning that most drivers experience less than 20 wet weather races in their entire career. Any attempt to break wet races down into further categories (e.g., mixed weather, full wet weather) for comparing performances under these different conditions is thus doomed to fail, as there simply aren’t enough data to make any meaningful conclusions.
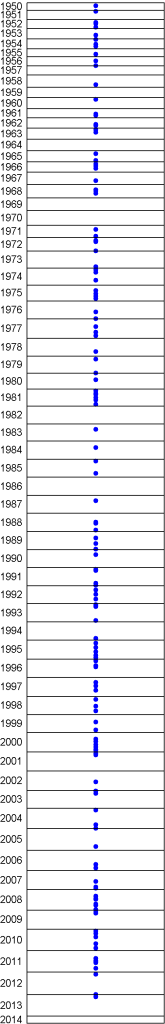
I therefore chose a binary definition: races are either wet or dry. I defined a race as being wet if there was a wet surface at any point during the race (including the start). Overall, 15% of Formula 1 races since 1950 have been wet, by this definition. On the left hand side, you can see a chart of all the wet races in history. Also, because it’s hard to actually find a comprehensive list of all wet races, I have included the list I compiled at the bottom of the article.
There have been 6 seasons where at least one third of the races were wet: 1952 (3/8), 1954 (3/9), 1966 (3/9), 1981 (6/15), 2000 (6/17), and 2008 (6/18).
There have also been 8 seasons with no wet races at all: 1957, 1959, 1964, 1969, 1970, 1982, 1986, and 2014 (so far).
Generally, wet races are considered more entertaining by fans. When F1Fanatic analyzed the user ratings of 100 races from 2008-2013, 17 of the 21 wet races from that time period appeared in the top 50. Wet races were much higher rated than dry races on average (28th vs. 56th) with a statistically significant difference (p = 0.00007, Wilcoxon rank-sum test).
Assessing performances
Now, how might one try to quantify wet-weather driving performances? The simplest approach, which others have looked at, is to check what percentage of wet races each driver won across their career. This statistic can potentially be skewed by mechanical failures, so for each driver I first excluded all races with mechanical or other non-driver DNFs, just like in my last post. The remaining starts (including finishes as well as races where a driver crashed or otherwise ended the race by their own hands) were analyzed. For this analysis, I used only the 50 drivers who scored at least 5 wins in their career.
When you do that analysis, here is what you find.
| # | Driver | Percentage of wet starts won |
| 1 | A Ascari | 80.0 |
| 2 | A Senna | 66.7 |
| 3 | JM Fangio | 57.1 |
| 4 | S Moss | 50.0 |
| 5 | J Clark | 42.9 |
| 6 | M Schumacher | 36.5 |
| 7 | J Stewart | 33.3 |
| 8 | G Villeneuve | 25.0 |
| 8 | L Hamilton | 25.0 |
| 10 | D Hill | 23.5 |
| 11 | J Hunt | 23.1 |
| 12 | J Brabham | 21.4 |
| 13 | J Button | 21.2 |
| 14 | S Vettel | 19.0 |
| 15 | E Fittipaldi | 16.7 |
| 16 | C Reutemann | 15.8 |
| 17 | J Ickx | 15.4 |
| 18 | J Surtees | 14.3 |
| 18 | K Rosberg | 14.3 |
| 18 | A Prost | 14.3 |
It’s worth noting that Ascari’s incredible 80% is based on a very small sample — he won 4 of the 5 wet races he started. Senna, in 2nd place, won 14 of 21 wet races he started (without non-driver DNFs), putting him well ahead of any other modern drivers. This analysis provides a measure of absolute performances in wet weather, although still partially confounded by car performance. While some drivers scored very well in absolute terms, wet weather was not necessarily their forté. For example, Jim Clark won 42.9% of all wet races he started, but he won 56.4% of all dry races he started! In other words, his odds of winning a wet race were less than his odds of winning a dry race. For many other drivers, the opposite is true.
Here is what happens if we rank drivers by the difference between their wet weather and dry weather winning percentages.
| # | Driver | Wet versus dry difference in percentage wins |
| 1 | A Senna | 39.7 |
| 2 | A Ascari | 35.0 |
| 3 | J Button | 16.7 |
| 4 | G Villeneuve | 14.7 |
| 5 | S Moss | 13.6 |
| 6 | J Hunt | 9.6 |
| 7 | K Rosberg | 7.6 |
| 8 | C Reutemann | 5.9 |
| 9 | J Ickx | 5.2 |
| 10 | F Massa | 4.8 |
| 11 | J Brabham | 4.8 |
| 12 | J Surtees | 4.5 |
| 13 | L Hamilton | 4.0 |
| 14 | E Fittipaldi | 3.4 |
| 15 | M Schumacher | 3.2 |
| 16 | J Laffite | 2.9 |
| 17 | JP Montoya | 1.7 |
| 18 | G Hill | 1.7 |
| 19 | C Regazzoni | 0.4 |
| 20 | R Barrichello | 0.1 |
Senna now emerges on top, with Ascari close behind. Very few drivers have much higher win rates in the wet than in the dry. Button, Villeneuve, and Moss all stand out as exceptional wet-weather drivers. Interestingly, Schumacher’s win rate in the dry was almost the same as his win rate in the wet; he simply excelled in all conditions.

An alternative method of comparing wet and dry performances is to take the ratio of the winning rates in wet and dry conditions (an alternative method that many statisticians prefer is to take the “odds ratio”, but many people find odds less intuitive to think about than probabilities). This tells us the factor by which a driver is more likely to win in a wet race than a dry race. A value of 1 means a driver is equally likely to win under wet and dry conditions. A value greater than 1 means a driver is more likely to win a wet race than a dry race. A value less than 1 means a driver is less likely to win a wet race than a dry race.
| # | Driver | Wet versus dry winning probability ratio |
| 1 | J Button | 4.75 |
| 2 | A Senna | 2.47 |
| 3 | G Villeneuve | 2.44 |
| 4 | K Rosberg | 2.14 |
| 5 | F Massa | 1.91 |
| 6 | A Ascari | 1.78 |
| 7 | J Hunt | 1.71 |
| 8 | C Reutemann | 1.60 |
| 9 | J Laffite | 1.53 |
| 10 | J Ickx | 1.51 |
| 11 | J Surtees | 1.46 |
| 12 | S Moss | 1.38 |
| 13 | J Brabham | 1.29 |
| 14 | E Fittipaldi | 1.26 |
| 15 | L Hamilton | 1.19 |
| 16 | JP Montoya | 1.19 |
| 17 | G Hill | 1.14 |
| 18 | M Schumacher | 1.10 |
| 19 | C Regazzoni | 1.09 |
| 20 | R Barrichello | 1.01 |
Button stands well ahead by this metric — he is an astonishing 4.75 times more likely to win a wet race than a dry race. Of Button’s 15 wins to date, 8 are from his 179 dry starts, while 7 are from his 33 wet starts. Massa is ranked second of the currently active drivers. Although many remember his disastrous performance in the wet at Silverstone 2008, he has 8 wins from his 153 dry starts, versus 3 wins from his 30 wet starts. Among other current drivers, Hamilton’s ratio is 1.19, Alonso’s ratio is 0.75, and Vettel’s ratio is 0.50.

Several drivers never won a race in the wet and so they have a ratio of zero. Every driver with 12 or more wins won at least 1 wet race in their career. The least proficient wet-weather driver of this group was Hakkinen, with a probability ratio of 0.15. He won 19 of his 86 dry starts, but only 1 of his 30 wet starts. Conforming to reputation, Prost was also typically less successful in the wet than the dry, with a probability ratio of 0.40.
Crashes
One of the greatest challenges of wet racing is simply getting to the finish. After excluding races where a driver did not finish for a reason beyond their control, I analyzed all starts of the 50 drivers with 5 or more wins. Overall, 12.5% of the dry starts ended in a driver-related DNF (crashing or retiring for another driver-related reason, as defined in my last post), whereas 20.5% of the wet starts ended in a driver-related DNF.

A handful of drivers paradoxically had lower driver-related DNF rates in wet races than dry races. Most notably, Senna had 16 driver-related DNFs in his 100 dry starts, but only 2 driver-related DNFs in his 21 wet starts. Button, on the other hand, follows the typical trend of crashing more frequently in wet races, with 14 driver-related DNFs in his 179 dry starts, and 5 driver-related DNFs in his 33 wet starts.
Points per race
So far, I have only considered wins as a performance metric. For most drivers, wins are a relatively rare event, so this will not be the most reliable metric, nor the most inclusive metric. An alternative is to consider points scored in dry versus wet races. To do this, we need to score points in the same way for all drivers, so I retroactively applied two different points scoring systems to all races: the 10-6-4-3-2-1 system that was used from 1991-2002 and the 25-18-15-12-10-8-6-4-2-1 system that has been used since 2010.
For this analysis, I included all drivers who scored at least 10 wins worth of points across their career — 100 points under the old system and 250 points under the new system. I again excluded non-driver DNFs for each driver. I calculated the average points scored per race under both wet and dry conditions. I then took the difference between the wet and dry scoring rates to assess how much better each driver performed in the wet than in the dry.
First, these are the rankings under the old 10-6-4-3-2-1 scoring system.
| # | Driver | Wet versus dry points bonus per race |
| 1 | A Senna | 2.51 |
| 2 | A Ascari | 2.10 |
| 3 | G Villeneuve | 2.07 |
| 4 | J Surtees | 1.55 |
| 5 | J Button | 1.35 |
| 6 | S Moss | 1.22 |
| 7 | J Ickx | 1.06 |
| 8 | T Boutsen | 1.04 |
| 9 | HH Frentzen | 0.91 |
| 10 | N Heidfeld | 0.65 |
| 11 | F Massa | 0.61 |
| 12 | J Hunt | 0.44 |
| 13 | R Kubica | 0.38 |
| 14 | J Alesi | 0.38 |
| 15 | G Farina | 0.29 |
| 16 | R Peterson | 0.27 |
| 17 | J Laffite | 0.19 |
| 18 | JM Fangio | 0.18 |
| 19 | L Hamilton | 0.17 |
| 20 | E Fittipaldi | 0.10 |
Many of the usual suspects are at the top of the list, although we now also see some wet-weather specialists who didn’t make the cut under the 5 wins criterion: Boutsen, Frentzen, Heidfeld, Kubica, and Alesi. Button is again the highest ranked active driver. Vettel is surprisingly well down the list, with -2.02 points per race in wet vs. dry conditions.
The next table shows the rankings under the modern 25-18-15-12-10-8-6-4-2-1 scoring system.
| # | Driver | Wet versus dry points bonus per race |
| 1 | G Villeneuve | 6.11 |
| 2 | A Ascari | 4.85 |
| 3 | A Senna | 4.78 |
| 4 | J Surtees | 3.30 |
| 5 | JF Gonzales | 3.06 |
| 6 | C Pace | 2.88 |
| 7 | J Ickx | 2.85 |
| 8 | HH Frentzen | 2.64 |
| 9 | S Moss | 2.61 |
| 10 | A Nannini | 2.35 |
| 11 | H Kovalainen | 2.15 |
| 12 | F Massa | 2.05 |
| 13 | J Button | 1.86 |
| 14 | R Peterson | 1.81 |
| 15 | N Heidfeld | 1.69 |
| 16 | G Farina | 1.57 |
| 17 | O Panis | 1.52 |
| 18 | R Kubica | 1.40 |
| 19 | T Boutsen | 1.37 |
| 20 | J Hunt | 1.31 |
This time, Gilles Villeneuve rises to the very top of the list. Notably, Massa also eclipses Button as the highest ranked active driver. Again, it emerges that Vettel, on average, scores at a considerably lower rate in wet races, to the tune of 5.27 points. In his 92 dry starts, he has scored 1475 ‘modern’ points (16.03 points per race) and 35 wins, with only 4 driver-related DNFs. In his 21 wet starts, he has scored 226 ‘modern’ points (10.76 points per race) and 4 wins, with 3 driver-related DNFs.
Conclusion
These metrics provide a sense of who were the greatest wet-weather drivers in the history of the sport. Certain names consistently appear near the top of each list. However, none of the metrics are ideal. Relative measures of wet vs. dry performance — like relative win rates or points scoring rates — tell us whether a driver performs relatively better in wet or dry conditions, but do not tell us their performance level in an absolute sense.
Absolute measures of success — like percentage wins in wet races — are still greatly affected by car performance. Wet races only partially level the playing field. In dry weather, 53% of all races since 1950 have been won by the year’s highest scoring constructor. In wet weather, 44% of all races since 1950 have been won by the year’s highest scoring constructor. To comprehensively answer who was the greatest wet-weather driver, we need some way of estimating both driver and car performances, so that we can adjust drivers’ results relative to the competitiveness of their cars. That is a very difficult problem, but one that I will address in my next post!
List of all wet races (year and round numbers)
1950: 3
1951: 1
1952: 3, 4, 7
1953: 6
1954: 1, 5, 7
1955: 5
1956: 4, 8
1957: –
1958: 9
1959: –
1960: 2
1961: 5, 6
1962: 6, 7
1963: 2, 4
1964: –
1965: 3, 9
1966: 2, 4, 6
1967: 8
1968: 5, 6, 8
1969: –
1970: –
1971: 4, 10
1972: 3, 4, 12
1973: 14
1974: 2, 4, 11
1975: 5, 8, 10, 12
1976: 10, 16
1977: 7, 12, 15
1978: 12
1979: 3, 15
1980: 6
1981, 2, 4, 5, 8, 10, 14
1982: –
1983: 5
1984: 6
1985: 2, 13
1986: –
1987: 5
1988: 8, 9, 15
1989: 6, 11, 16
1990: 5
1991: 2, 3, 14, 16
1992: 4, 8, 12
1993: 1, 2, 3, 15
1994: 15
1995: 3, 7, 11, 14, 16
1996: 2, 6, 7
1997: 5, 8, 12
1998: 3, 9, 13
1999: 7, 14
2000: 6, 8, 11, 13, 15 16
2001: 2, 3
2002: 10
2003: 1, 3
2004: 2, 15, 18
2005: 16
2006: 13, 16
2007: 10, 15, 16
2008: 6, 8, 9, 13, 14, 18
2009: 2, 3
2010: 2, 4, 7, 13, 17
2011: 7, 9, 10, 11, 16
2012, 2, 20
2013: 2
2014: –

[…] out of the equation. Villeneuve was a spectacular driver with uncanny car control and wet-weather flair, but he also made frequent driver errors. In 1978, he was beaten by the more experienced Carlos […]
[…] dry weather conditions. It could potentially be extended to different weather conditions, including changes in driver performances and crash rates in wet weather that I previously computed, changes in lap times, and changes in […]
In addition to comparing the ratio of success in the wet and in dry races, it would be also interesting to make the calculation using wet weather performance vs. car performance as inferred from your model. I always had the impression that the reason why Schumacher had such a high number of wins in wet races was more related to the fact that he had a very large number of races on top equipment while paired with drivers of modest talent. Of course, he won races in 96, but before 94 he had many opportunities to show his performance in wet weather but very rarely succeeded (even when he did win, in Spa 92, it was because everybody else who was fighting for the win, including his own team mate who was ahead, had some serious problem). This is in striking difference to Senna, who was able to get good results in wet races regardless of machinery or the strength of the oposition, as seen in his podiums with the Toleman or his impressive wet races against the 93 Williams. An interesting statistic about Senna in the wet is that there was never a wet race on which he wasn’t running among the top three at some point of the race. In other words, if there was rain, one could be absolutely sure he would be at least fighting for a podium. By the way, when people discuss Senna’s abilities, it is usually remembered that there were three points on which he was perceived as above everyone else – wet weather performance, single lap performance and proficiency on street circuits. Particularly Monaco, on which he debutted with a podium and a fastest lap in modest equipment, and then had a further six wins, a P3 and two DNFs while leading (one of which his own fault, of course, but still an impressive record). I would be curious in seeing calculations for quali or street circuits to see what would happen, specially with those not usually remembered (from recent drivers, I guess Trulli is someone who would probably be remembered as a top qualifier if he ever had the machinery to match his talent).
I wouldn’t go so far as to say ‘Garbage In, Garbage Out’, but I will point out that you are drawing conclusions which the data cannot really support. Superficially it may seem “fair” to simply discard races which a driver has not finished, from both the numerator and denominator of your calculations, but given the very small data sets involved here and the reality that numbers as small as “1” or “2” can greatly affect the results, I don’t think it’s supportable.
Take Korea 2012 for instance. Vettel was leading that race comfortably in the rain when he suffered an engine failure. So you delete that race from your calculations. You don’t hold it against him, but nor do you him credit for it. Yet if his engine holds up there then (because the numbers involved are so small) his winning percentage in the wet rises sharply. In fact if he had not suffered that engine failure, and another car failure while leading the race in the rain in Australia in 2010, his percentage of wet starts won would be higher than those of both Button and Hamilton. Neither of whom, as far as I can tell, ever lost a win in the wet due to a car failure.
Since I only analyze drivers who completed at least three races in at least three separate seasons (and most drivers have many more than that), sample size is not a big concern. Excluding mechanical DNFs would only be a problem if a driver *systematically* performed better or worse in races where their car failed than in races where their car didn’t. There’s no reason to think that should be true.
“Excluding mechanical DNFs would only be a problem if a driver *systematically* performed better or worse in races where their car failed than in races where their car didn’t.”
What a ridiculous statement on its face. The obvious question is how is it possible to assess whether or not a driver “systematically” performed better or worse in a race where their car fails?” So, what is being said is, exclusion of those races is based on a logical fallacy.
What is sorely needed in today’s, I can judge worth solely through numbers sports environment, is a PupPeer.com for “statistical analysis” websites and their owners who perform the analyses.
That could obviously be assessed via other metrics, although it would be a lot of work. There’s no fallacy at my end.
[…] take this race under any conditions. He has never had a problem racing in the rain and even becomes more likely to win on wet tracks. If you were hoping to back Hamilton this time around, you can thank Hurricane […]
Interesting analysis!
A question: why Massa has 3 wins in wet weather? I think, he won only 2: Belgium and Brasil 2008. What’s the third?
Furthermore Massa’s victory in Belgium is a sort of “fake” because Hamilton won the race, but he has been penalized at the end for the unregular overtake on Kimi.
It’s quite interesting to see as Micheal Schumacher doesn’t never appear in the first places, even if everyone knows he is a rain master almost like Senna. He was particulary talented to understand weather and choise the right tyres and car-set up! I remember Monaco or Spa ’97 when he lead the races gaining also 6-7 seconds every lap!
The third was France 2008, which had some light rain near the end.
[…] verdade que esta análise, como bem aponta o pesquisador Andrew Phillips (num estudo muito mais interessante e detalhado que o nosso), ainda é perturbada pelo peso da qualidade técnica do carro no desempenho dos pilotos. O que, na […]
[…] verdade que esta análise, como bem aponta o pesquisador Andrew Phillips (num estudo muito detalhado), ainda é perturbada pelo peso da qualidade técnica do carro no desempenho dos pilotos. O que, na […]
[…] the qualities that make a driver popular with fans and pundits: phenomenal car control, raw speed, wet-weather skills, and willingness to take (often insane) risks. Yet the results weren’t always there. The […]
Shouldn’t indianapolis 2003 be in the list of wet races? Maybe not wet start, think it started raining later, but sure there were a lot of laps where everyone was on intermediate tyres!
Wouldn’t including mixed conditions races add noise to the analysis? Many times in F1 history we’ve seen odd results in such races on which drivers who were driving extremely well got poor results (or the opposite), usually because changing conditions may result in very luck-dependent outcomes. For example, sometimes a driver was not doing particularly well but is lucky to have his pit stop scheduled right after the rain started, while someone who was doing great gets a poor result because the rain started exactly after he took his pit stop for dry tyres and then he needs another one.
In order to have such results as unbiased as possible, I guess one should only include races where it rained throughout the complete event.
Your comment makes sense, but I think you forgot to consider a detail: full-wet races such as spain 1996, monaco 1997, spa 1998 are incredibly rare and if the author were to consider only those I’d assume he would never get a sufficient size sample for this analysis.
If you check some of the listed “wet” races in wikipedia you will see some (included in the analysis) only had rain before race started or towards the end of it, so by all means I believe indianapolis 2003 fulfills the requirements to be counted as a wet race, it had far more laps under rain than some of the races, and I’m still interesting in knowing why the author didn’t include that.
Yes, I agree that will mean sampling will be very poor. By the way sampling is probably the second biggest problem for doing F1 statistics (the first obviously being the fact that we’re not comparing like with like when drivers have different cars).
Interestingly, Indy 2003 is itself an example of a race that could have a different outcome if not for the changing conditions. From what I remember, Montoya got a questionable penalty (he was blamed for his entanglement with Barrichello who was clearly “doing an Irvine” to mess with his race), and had to pay a drive through exactly when it started to rain. Which meant he had to stop for his drive-through, then make a full lap with dry tyres when everybody else had full wets, and then go to the pits yet again to put the correct tyres on, which basically destroyed his race (and his chances of winning that WDC).
If it was an “all wet” race he probably wouldn’t win anyway as the full wet Michelins were far worse than the Bridgestones in that race, but it certainly wouldn’t be the disaster result he had due to the heavy rain timing.
This is in answer to your last comment btw, but it doesn’t have the reply button: yes, was a series of bad circumstances for montoya, apart from the penalty I think he also delayed far more changing to wet tires, and even then he got lapped by heidfeld and trulli, wasn’t able to recover anything from them while he had a far better team; I’m sure heidfeld had bridgestones, but not sure about trulli, if he had michelins it would be weird that a williams can’t keep up with a renault with the same tires.
By the way, in indianapolis 2.003 as far as I know drivers only used intermediate and slick tyres, full wets weren’t used, bridgestone seemed to have like 2 sec advantage with similar car on michelin, but not sure what would have happened if rain had intensified and they had needed full wet, italian commentators during the race said they should give a slight advantage to michelin, but no idea since we didn’t exactly have a lot of heavy rain races over the years and already in 2.006 (china) the situation had totally changed, with michelin intermediate tyres being superior to bridgestone intermediates on non-heavy rain.
Typo, meant to say I’m interestED in knowing why indianapolis 2003 hasn’t been counted as a wet race since it rained a bit during it but not at the start by the author, but wasn’t able to edit my old comment.
After reading all the comments since 2014, it is true there are several ways to compare statistics from one pilot to another, it is very difficult to compare the eras to another, the constructors to another, but In the end what distinguishes the best pilots is their ability to bring emotions to the audience and an emotion is not evaluable, it’s something you feel. On May 8, 2017 it will be 35 years since Gilles died in Zolder and every time we talk about Gilles, the first words are passion, determination, kindness, This is what makes a great champion..
SALUT GILLES
[…] demostraron ser regularmente más lentos que sus compañeros? Estas cifras, obtenidas del estadista f1metrics, confirman que la habilidad en agua no lleva implícita la habilidad general como piloto, como […]
Lo siento, pero lo que dice no tiene sentido
I’d be interested to know how Hamilton’s ranking has changed over the last few seasons, with a number of impressive wet wins (e.g GB & Brazil 2016, US 2015) and a few others where luck probably played a significant role too (Monaco 2016 and Yesterday in Singapore). Verstappen has also garnered a reputation as an outstanding wet driver, although he never had the chance to show it yesterday and wouldn’t register in this due to his lack of wins.
how many wet races have there been in 2015 , 2016 and 2017 and who won them ?
The following races were wet.
2014: Hungary, Japan
2015: Britain, USA
2016: Monaco, Britain, Brazil
2017: China, Singapore
Hamilton won all of these except Hungary 2014.
Would be interesting to see how Hamilton’s wet weather ranking has changed after the last few seasons. He seems to be getting quite a reputation in the wet, I wonder if your model incorporating current data reflects that opinion?
Thanks for the suggestion! I’m thinking of adding a section on this to the end of season report.
Yes, hamilton definitely is a good wet weather driver, and barrichello is another driver that, while average in dry conditions, excelled in the wet, almost every time it rained you could expect to see him further ahead than usual, some examples being silverstone 2008, spain 1996 (although retired due to mechanical), monaco 1997, france 1999, nurburgring 1999, all of these in inferior cars ofc.
However, I was the one asking you on reddit why you didn’t include indianapolis 2003, is it possible at all to update the blog post with it?
If not, I see schumacher has a 36,5% win rate atm, how much would it be with indianapolis included? What is his total of wet races entered vs won?
Truly no matter if someone doesn’t be aware of then its up to other viewers that they will help, so here it happens.
[…] and a half years ago, I published an analysis of historical wet-weather performances. For these analyses, I classified races as either wet or dry. A race was classified as wet if the […]
[…] recognize that Senna was one of the greatest wet-weather drivers in history. Across his career, Senna was 2.5 times more likely to win a wet race than a dry race, and he was no slouch in the […]
[…] a wet-weather specialist, with two of his three wins coming in wet conditions. As I have shown in a previous post, Boutsen ranks among the top drivers when comparing wet-weather scoring rates to dry-weather […]
If statistics was that easy, you’d be right. Unfortunately it’s not. For a proper mathematical evaluation of wet F1 performance, google ‘best f1 driver according to science’