 Recently, I decided it was time to make some improvements to the f1metrics model.
Modeling is usually an iterative process. A model is defined, its performance is evaluated, and the lessons learned are fed back into the model definition. This process can in theory go on forever.

Models are (by definition) reduced abstractions of a system that allow us to see things we can’t readily see from raw data. But they are never a complete description. In the famous words of George Box,
All models are wrong, but some are useful.
When models are not useful, we usually go right back to the drawing board. When they are useful, we look for ways to improve them. Like most useful models, the f1metrics model has therefore been iteratively developed over time. Let’s step back and do a quick review, before we get to the new parts.
First steps
I first started playing around with the idea of such a model back in 2002, but I lacked the formalism and database to do it rigorously. All I could really confidently conclude from that initial exercise was that Michael Schumacher would clearly outrank Ayrton Senna (something that didn’t much please me as an Ayrton Senna fan). In 2013, I returned to the idea. I manually scored the results of every F1 race since 1950 to ensure all DNF types were treated accurately and I set about the stages of testing and rejecting candidate models.
As someone trained in physics, my first inclination is almost always towards the most reduced (i.e., simplest) possible model of a given phenomenon, building up additional factors from there only as needed or as they add value. The first f1metrics model was therefore a very simple one. A driver’s scoring rate in each season was represented as a function of driver performance, team performance, and competition with other drivers in the same season. A nonlinear linking function (a sigmoid) turned the combination of these factors (predictors) into a predicted scoring rate (the outcome variable), which I calculated using counting races (i.e., only races where a driver did not experience a non-driver DNF, such as a mechanical failure). Remaining unexplained variation represents factors not explicitly modeled, such as fluctuations in driver form from season to season.
Performance = Driver + Team + Season + variation
Scoring rate = S(Performance)

Top 20 rankings from the 2014 f1metrics driver rankings. Drivers are ranked on a normalized scale of points per race (ppr) with a possible range of 0-10.
The first application of this model was an attempt to rank drivers across F1 history, based on comparisons between teammates (since these drivers share the same values for the Team and Season terms, allowing differences in the Driver term to be detected). This exercise generated many interesting insights, including challenging or confirming long-held subjective views of experts, by confronting these views with data. In many cases, the rankings led me to dig deeper into the data, revealing interesting facts that I might not have otherwise noticed, such as the role of F1 drivers in determining the likelihood of mechanical DNFs. It also allowed for other applications, such as reevaluating each year of the F1 world championship by taking the Team effect out of the equation (i.e., imagining what would happen if all drivers had equally competitive cars), and ranking the most dominant F1 teams in history by taking the Driver effect out of the equation (i.e., imagining what would happen if all teams had equally competitive drivers).
Yet, it was also clear from the outset that the model was missing certain things, leading to what almost any observer would rightly consider anomalous results. As I noted at the time, Nico Rosberg’s ranking at #7 followed computationally from him beating Michael Schumacher as teammates from 2010-2012. But it was beyond doubt that Schumacher in his early 40s returning from a substantial career gap could not be equivalent to Schumacher at his peak. Similar reasoning could be applied to the surprisingly high rankings of John Watson at #15 (who faced Niki Lauda on his comeback) and Heinz-Harald Frentzen #17 (who faced Damon Hill in the twilight of his career), among others.

Teammates Nico Rosberg and Michael Schumacher.
At this point, it should be recognized that modeling driver rankings is pretty difficult, even with a lot of data at your disposal. This is because in F1, unlike other sports, we have an inherently uneven playing ground. Separating what the driver did from what the car did is no simple task, as evidenced by endless unresolved subjective debates on the topic. Proposing a scheme that generates sensible rankings is really far more difficult than it might at first seem. The first serious objective attempt by anyone that I am aware of was a paper published in 2009 by Eichenberger and Stadelmann. That model had Mike Hawthorn at #5, Erik Comas ranked ahead of Ayrton Senna, and numerous other rankings that, had I produced them, would have undoubtedly led to an explosion of hate-mail in my inbox.
A much better model published by Bell and colleagues in 2015 passed a lot of basic sanity checks and produced many similar results to the 2014 f1metrics model. It also generated some spurious results, such as Christian Fittipaldi ranked at #11 in the all-time driver rankings (due to the way it punished drivers for mechanical DNFs). That model also side-stepped the above Michael Schumacher vs. Nico Rosberg issue by splitting Schumacher’s career into two separate drivers (a treatment not applied to any other drivers).
To see just how wrong driver ranking models can go, even with quantitative expertise on hand, refer to the trainwreck of a list published by fivethirtyeight (a site I otherwise greatly respect). In this case, drivers were ranked using Elo rankings (a method typically used for rankings in head-to-head disciplines such as Chess) that simply compared their race results to all other drivers on the grid. This model failed to account for varying car competitiveness between drivers, and between seasons within drivers, which is of course the major explanatory factor for all results in F1. This is akin to trying to predict climate change while forgeting to include carbon dioxide. Such a model ends up concluding that David Coulthard and Mark Webber were better drivers than Fernando Alonso and Jenson Button, almost solely by virtue of having spent more time sitting in top cars. This is a cautionary example of what can happen when modeling is applied with insufficient incorporation of domain knowledge.
Age and experience
From the above results, it seemed that the most valuable addition to the f1metrics model would be to incorporate the effects of age and experience. In the sports modeling literature, one of the classic examples of modeling age effects is a 1999 paper by Berry and colleagues, which analyzed how age affects performance in three different sports (golf, ice hockey, and baseball). I have combined the data from graphs in that paper into the following plot.
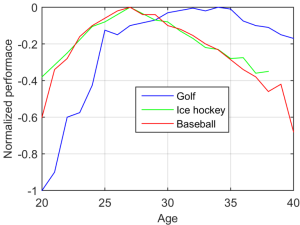
Estimated effects of age on athlete performance for three different sports. A y-value of zero represents peak performance. Figure adapted from multiple plots in Berry et al. (1999) Bridging different eras in sports. J Amer Stat Assoc.
We can see from this plot that athletes tend to peak between the ages of about 25-35, with different age trends for different sports. Similar analyses have been applied to many measures across many different sports. In general, sports that require short reaction times and explosive strength or have high risk of injury (e.g., contact sports) have earlier and sharper age peaks, whereas sports that exert less wear on the body and are more reliant on experience tend to have later age peaks and longer plateaus.
While there are several sports statistics models out there that consider the influence of age on performance, there are almost no models that explicitly consider the effect of experience (i.e., number of years competing in the discipline). The simplest explanation for this is the fact that age and experience in many disciplines tend to strongly covary, since athletes begin training at a similar age. In such cases, experience is not a useful independent predictor, so it can potentially be ignored.
This, however, is a problematic assumption if we are dealing with F1 drivers. In F1, we routinely lower our expectations for drivers in their rookie year. Anyone call tell you that a driver who is 23 with 4 years experience in F1 ought to be at an advantage relative to a driver who is 24 but an F1 rookie, regardless of how long they each spent in the junior ranks. Why? Because there is a formidable step in moving from any other category to F1. The challenges of F1 are specific and different from other categories, including junior single-seater categories. The cars in F1 are faster, the tyres have different dynamics, and the complexity of team dynamics and technology are much higher. We see a similar challenge for drivers who return after a protracted period away from F1 and we accordingly lower our expectations there too.
We therefore need to model both the effects of age and experience on performance if we are to accurately capture performance changes across the career arc of an F1 driver.
In 2017, I developed a new version of the f1metrics model that captured both the age and experience effects. This was essentially an extension of the original f1metrics model to include an Age term and an Experience term in the Performance function.
Performance = Driver + Team + Season + Age + Experience + variation
Scoring rate = S(Performance)
The effects of experience are fitted based on the number of the previous four seasons in which the driver competed in F1. This definition of ‘recent experience’ allows the model to also temper expectations for returning drivers, since their experience may be too long ago to contribute to the count. For example, on return in 2010, Michael Schumacher had competed in only 1 of the previous 4 seasons. This definition seems sensible given the constant evolution of F1 — knowledge of F1 cars from 5+ years ago is largely irrelevant today. I found that the experience curve tended to flatten out after four years, so chose this function as a parsimonious model. One could argue that the experience function ought to also somehow incorporate the number of years of car racing a driver completed before F1. This is not straightforward, however, as karting (the staple of young drivers today) is a relatively new invention.
Historically, there is one tricky case in modeling experience effects, which is the beginning of the championship in 1950. Technically, we could treat every driver as a rookie in 1950, but this would be misleading. Some of the drivers were extremely experienced in racing grands prix pre-war and post-war, with many racing F1 cars from 1946-1949 (as the category existed before 1950). I therefore recorded each driver’s participation in grands prix from 1946-1949 as input to the model, allowing it to distinguish drivers who genuinely debuted in 1950-1953 from those with prior experience.
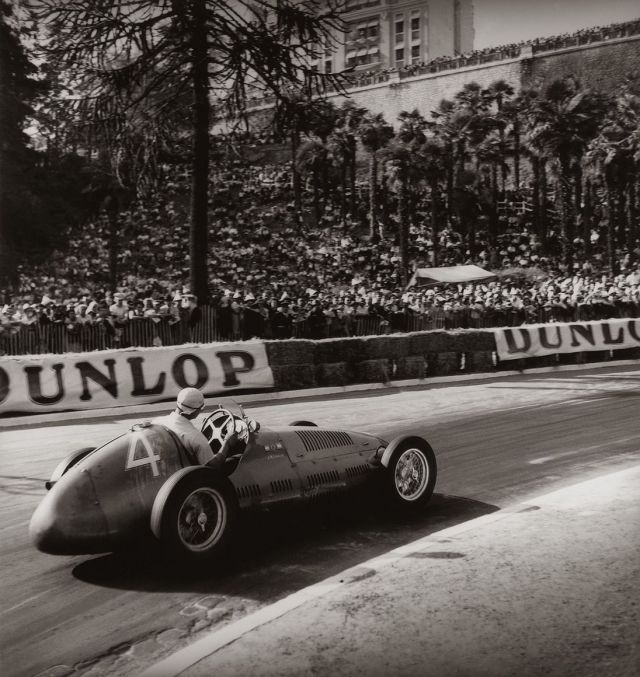
Juan Manuel Fangio racing in the 1949 Pau Grand Prix.
The effects of age were fitted as a curve (with parameters corresponding to values every 3 years from 20-47, where there were at least 10 drivers for each age value; other values were interpolated/extrapolated). This curve represents the average effects of age on driver performance across all driver careers in F1 history. I note that I also attempted fitting this function for earlier vs. later eras of F1 separately to see if the curve changed, but did not find systematic differences.
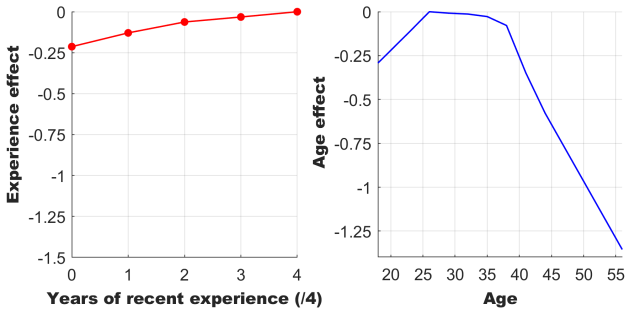
Model-fitted curves for experience (red) and age (blue) effects on driver performance.
With respect to age, the model shows that F1 drivers plateau in abilities from about 26-35, with lower performance on either side of this.
For reference, the average difference in the performance variable between Hamilton and Bottas is ~0.4. The effects of being a rookie compared to being an experienced driver (controlling for age) are about half this size. Comparing the age and experience curves, we see that the effects of age can be much larger than the effects of experience. However, across the age range that most drivers currently compete in F1 (~20-40), the effects are quite similar in size, each accounting for up to ~0.2 change in performance, as shown below.

Combining these factors can therefore account for up to ~0.4 change in performance in a typical modern F1 driver career. In other words, the estimated difference between Hamilton and Bottas in performance is similar to the difference between a rookie driver aged 20 and the same driver at their peak.
Besides dealing with cases such as Michael Schumacher vs. Nico Rosberg, this adjustment to the model allows predictions of how drivers would have performed at different ages, such as in my historical hypotheticals series. For example, below is a prediction of how James Hunt would most likely have performed had he returned to F1 in either 1982 or 1990 (both comebacks that he seriously considered).

Estimated performances for James Hunt, assuming a comeback in 1982 (green) or 1990 (red). The colored dots and curves show the most probable prediction. The shaded regions indicate the combined standard error in estimates of Hunt’s driving performance, as well as age and experience effects on performance.
Customer cars
Up to this section, I have described components of the model that I have used for previous blog posts, including the 2018 driver rankings. Now, I describe two more recent additions that I think have really improved the model. My maxim in developing the f1metrics model has been to only include factors that can be measured objectively. One such factor that I have neglected until recently is the role of customer cars. This is a factor that does not substantially affect modern rankings, but does critically affect interpretation of rankings for drivers in the 1950s-1970s.

Hector Rebaque driving a customer Lotus 78 in 1978. He scored 1 point that season while the works Lotus team won the drivers’ and constructors’ titles.
For a long period of F1 history (1950-1980), many F1 entrants relied on using customer cars to race. Customer cars were banned by the 1981 Concorde Agreement, which required teams to construct their own cars. Before this, it was not required for entrants to construct their own cars, meaning teams could buy a pre-made car from another manufacturer and enter it themselves. As one would expect, customer entrants tended to be at some degree of disadvantage to works (manufacturer) entrants, since they were typically less well resourced, had less expertise regarding the chassis, and frequently did not have access to the very latest upgrades.
Until now, the f1metrics model has not taken the role of customer cars into effect. If two drivers were racing the same chassis-engine combination in the same season, they were treated as teammates on a level mechanical footing. As an example, this means that the model would treat Jim Clark and Paul Hawkins as having equal car performance in 1965 when they both raced the Lotus-Climax, despite Paul Hawkins racing a customer car (as the privateer entry DW Racing Enterprises) and Jim Clark having the full support of Team Lotus. Similarly, the model treats the many Maserati customers in the early 1950s as having equal equipment to the Maserati works team. These are potentially problematic assumptions that may exaggerate the advantage of works drivers over their peers.
I considered two ways of tackling this problem. The first is to independently fit the performance of every single entrant (i.e., altogether ignoring the fact that two drivers have the same chassis-engine combination). The second is to fit an average effect of having a customer car across the period 1950-1980. I opted for the latter as a more parsimonious and powerful model, since treating each entrant completely independently throws away information (there is likely to be at least some similarity between customer and works cars) and also introduces a large number of extra model parameters to be fitted.
Performance = Driver + Team + Season + Age + Experience + Customer + variation
Scoring rate = S(Performance)
Using this model, I found the size of the average customer car effect, as plotted below.

From this, we find that the average size of the customer car effect on performance is ~0.2. This is comparable to:
- The performance difference between a rookie vs. an equally talented experienced driver (controlling for age).
- The performance difference between a 21 year old vs. an equally talented 26 year old (controlling for experience).
- About half the average performance difference between Hamilton and Bottas.
This passes a sanity check, given customer cars tended to be slightly worse than their works counterparts, as a general rule.
Robust scoring

Lance Stroll, celebrating his podium at Baku 2017.
There’s no two ways about it. Lance Stroll is a problem.
I first noticed it in 2017 when, by virtue of an opportune podium, Stroll outranked teammate Felipe Massa in my end-of-season report. Stroll was running behind his teammate in that race until mechanical failure on Massa’s car essentially handed the podium to Stroll. Due to the high weight the points system gives to top positions, and given Williams were otherwise largely uncompetitive in 2017, this podium had a major effect on Stroll’s total points haul compared to Massa’s. They ended the season almost tied, at 43-40 points in the official standings. Had the mechanical DNFs simply been reversed in that single race, the rankings of the Williams drivers would have had a completely different complexion, with Massa now leading 58-25 in the official standings. This indicates high sensitivity of the model rankings to a single race.
A similar situation arose more recently with Stroll’s 4th place in the 2019 German GP. On a background of being consistently beaten by Perez in races, one fortunate result put Stroll as the team’s temporary points leader. To put it another way, this single race result was worth 63% of Stroll’s total points scoring in the season to date.
Of course, I shouldn’t single out Stroll. This is a general problem and one that I have noticed since early incarnations of the model. We see it also with Kubica currently leading Russell 1-0 on points, where there can be no doubt Russell has been the far stronger driver this year.
I tried to demonstrate and partially correct for the model’s sensitivity to outlier results last year by checking the range of driver performance rankings under the assumption of removing up to one race from each season of each driver’s career. However, this is a post-hoc fix. A bandaid solution.
Ultimately, we could consider this a failing of the official F1 points system. The fact that no points are awarded beyond 10th place means a single 10th place will outweigh any number of 11th places. Moreover, the scaling of the points system from places 1-10 means that a single freak result for a driver in a midfield car can dominate their season points tally.
The original f1metrics model actually partially fixes this problem already, since it extends the points system beyond 10th place, by continuing the points system down as an exponential decay (following the decay rate of the 10-6-4-3-2-1 system, meaning a factor of 10 decay for every 5 places). For this reason, in the f1metrics system, Russell currently already outscores Kubica in 2019 (0.266 points to 0.240 points). However, this clearly doesn’t fix everything. Freak race results remain a common source of anomalous driver rankings.

Comparison of the old f1metrics and updated f1metrics scoring systems, including reference to the actual 10-6-4-3-2-1 and 25-18-15-12-10-8-6-4-2-1 points systems, which stop at 6th and 10th place, respectively. The top plot uses linear axes. The bottom plot has logarithmic y-axis.
One way that statisticians deal with distributions that contain freak results is to take more robust measures of central tendency, such as a trimmed mean (i.e., excluding outliers). If we look back through F1 history, such robust points systems have actually been used. From 1950-1990, only a certain number of best finishes counted, meaning drivers were able to exclude several of their worst race results. A single unlucky DNF essentially didn’t matter under such a system. This type of system is more robust against unfortunate results, but it doesn’t deal with freak fortunate results. For that, we would need to exclude a driver’s worst and best result(s). For example, only keep their middle 18 finishes out of 20 races.
The main argument against such a system is that it’s unfair to exclude a driver’s moments of genius. For example, we would be left completely ignoring Senna’s Monaco 1984, Vettel’s Italy 2008, etc. The problem boils down to the fact that, on the basis of race results alone, we cannot possibly distinguish a brilliant drive from a lucky result. To address this we would essentially need to delve into telemetry data, which (a) we don’t have for much of F1 history, and (b) would require a far more complex model, with its own shortcomings.
After pondering this for a while, I came to a compromise that evaluated well. Rather than totally excluding a driver’s best and worst results in each season, I counted them at 50% weight. This is enough for the results to still matter, but not enough to totally skew a driver’s scoring rate based on one strong race. While it makes very little difference to the rankings of most drivers, it does deal with several historically anomalous cases.
Based on simulations of driver finishes across thousands of seasons, I also found that a slightly flatter points system (one that lowers points by a factor of 10 every 7 places, which more closely resembles the current points system) gives a theoretically slightly better probability of ranking drivers according to their (hidden from the scoring system) actual abilities than the default f1metrics scoring function. This function is illustrated in the graph above. Again, this change has very subtle effects for the rankings of most drivers, but also slightly improves robustness in cases of outliers.
With these updates to the points system, we can see how a driver such as Stroll, with his outlier results in Baku 2017 and Germany 2019, ends up scored differently, resulting in rankings with better face validity.

Season rankings of Lance Stroll under different points systems. *2019 season is ongoing.
What’s coming next?
To summarize the above timeline, here is how each version of the f1metrics model has been applied to date.
Original f1metrics model (2014-2016):
- Who was the greatest F1 driver?
- 2014 model-based driver rankings
- A reconstructed history of F1
- The most dominant teams in F1 history
- 2015 model-based driver rankings
- 2016 model-based driver rankings
f1metrics model with age and experience effects (2017-2019):
- 2017 f1metrics end-of-season report
- Historical hypotheticals: Part I
- Historical hypotheticals: Part II
- 2018 f1metrics end-of-season report
- Historical hypotheticals: Part III
- Historical hypotheticals: Part IV
- Historical hypotheticals: Part V
Updated model (2019-):
Once the historical hypothetical series using the age and experience model is finished (two parts left), I have some significant plans using the fully updated model. This will include the usual f1metrics end-of-season report (now with a more robust model), as well as a long-overdue update of the 2014 all-time driver rankings. Having seen the new ranking list the model produces, expect some significant shake-ups!

Thank you for the update! Been missing you for the first half of the season. Several technical questions, if you don’t mind:
1. Does performance in adverse conditions evaluated the same way as dry, ‘average’ race? I’m not just talking about extreme wet, but also extreme heat and greasy tracks.
2. Can I make a bet now and say the final edition of the ‘Hypothetical’ model will include M. Schumacher?
3. When will you make an update to the overall historical ranking of drivers and teams?
Thanks for your hard work!
Thank you!
1. Yes, these are treated all the same at the moment. I’ve considered adding a wet weather variable, but it’s tricky to fit wet vs. dry performance at the individual driver level due to wet races being rare events. I can sort of look at it post hoc to estimate who are the best wet weather drivers, which is something I’m hoping to do in the next series of posts.
2. He will be featuring 🙂
3. I’m writing it at the moment. I will probably release it near the end of the season.
The new all time list will include Stroll, Leclerc because of 3 seasons in f1, but not these new drivers who came this year right?
Yes, I am sticking with 3 years as a minimum time window for assessing a driver’s peak, so that will include Stroll, but not yet include Leclerc.
Forgot that Leclerc began driving last year. Vandoorne is not going to be included I suppose because of insufficient races in 2016? I am asking this because if they are not going to be mentioned in the all time list maybe you can already tell us their ranking according to the new model and their 2-year peaks in these comments. It is not much of a spoiler for the main list but it would be a good teaser for us, to ponder about if they are ranked there where could others be possibly ranked when compared to them, it would give an interesting head scratch for us, your readers. What do you think? You could do it here or in a tweet, doesn’t matter.
Quite right. I’m working on a break down that will allow those drivers to be covered at least within their era.
Not gonna lie, I was hoping for an updated list, I have a suspicion over who I think is no. 1 in the new list so will be interesting to see if I’m right. Look forward to reading it.
(I also lol’d at the exposition that “Lance Stroll is a problem”)
oooh, I’m looking forward to this!
Great stuff, very interesting. Can’t wait to see the results when this model is applied !
Thanks for doing these, they are some of the best punditry F1 has to offer! Question: Last time when ranking the best drivers of all time, you measured a driver’s peak by their best average over a period of 3 consecutive years. Have you considered using alternative methods, for example using just the drivers best three seasons of their career, no matter their order? Or trying to figure out ways to reward drivers who were at the top for a long time, relative to those with shorter peaks? At least it would be interesting to see if different methods result in significantly different rankings.
Also, the model has the potential for a whole lot of other entertaining lists, such as “who was the most inconsistent driver” (highest variances in season-to-season performance). Another thing that could be looked at is if for example traction control and its subsequent ban really made driver skill more impactful – did gaps in driver performances measurably grow after the ban?
Thank you! There are definitely a variety of ways in which we could compute driver peaks. My own observation is that the lists computed for best 1, 2, 3, 4, and 5 year intervals tend to be very similar, with the caveat that drivers with a career shorter than the interval drop out. 3 years seemed to me a reasonable compromise between capturing relatively sharp peaks (e.g., some fans think Raikkonen from ~2005-2007 was at a different level from other parts of his career) and ensuring some degree of robustness (since single year measures can be quite noisy, especially in the 1950s-1960s with shorter seasons).
I very much agree regarding your suggestions! I have thought about an inconsistency list, though in the past when I considered it I was not modeling age and experience effects. Now that I could appropriately adjust for those terms, I think it could be quite a meaningful analysis.
I’m surprised to see that young age has a negative impact independent of experience. Do you have any idea why that might be the case?
It’s a good question. It cannot be related to reaction time. It may well be related to impulsivity or maturity.
Really really looking forward to an updated all time list! Will be great to see Verstappen and Ricciardo in the mix somewhere. I’d also say that I personally feel that a long explanation of each drivers position is not really necessary if it is time consuming. 🙂
Thanks again
I like when there are longer driverdescriptions and explanations of ranking. It is very useful and informative and makes for a more interesting read
Noted! I am planning to include some explanatory text/graphs for each entry.
1. “Due to the high weight the points system gives to top positions, and given Williams were otherwise largely uncompetitive in 2017, this podium had a major effect on Stroll’s total points haul compared to Massa’s.”
As you’ve said, Massa was really the more competitive driver in Baku. How would you feel about a model that doesn’t punish drivers for mechanical retirements?
Say, we calculate Massa’s performance relative to Stroll up to the point where he was in the race and then we use that for a more precise final approximation of the two drivers’ seasonal performance.
Of course, if Massa had driven only half the race, we lower the confidence rating of that result compared to ones where he finished the entire race.
2. What about going back and comparing car+driver performance in end result relative to the strength of the field in each race? For example it’s not the same getting a podium in a race with no retirements compared to a race where several frontrunners retired. Would that make sense? Do you already have something like that implemented?
3. Are driver retirements treated as 0 points? It seems that in an extended points system that measures performance retiring really only means you came last, but not by a margin any bigger than it is necessary. For example 20 cars started the race but 14 finished it because 6 drivers made driver errors. Instead of points for the first 14 and 0 for everyone else, we could treat the 6 retired drivers as having all finished P15.
1) The problem with a projection model is that it gets subjective very quickly. Final results are dependent on race strategy and lots of other factors. Once you imagine one or two drivers back into a race, now it affects other drivers too.
2) It’s a good idea. I have thought about adjustments at the race level, but I haven’t found a solution of that type that I’m really satisfied with.
3) If a driver crashes out, yes. Non-driver DNFs are just excluded. I have experimented with awarding points for crashes corresponding to the position, but it makes virtually no difference to driver rankings.
About number 2. Of course it is not the same when frontrunners crash and someone gets on the podium becuas of that. But I think that it is not the same if that happens in a normal conditions race and a rain covered race because finishing on podium in a wet race because someone retired in front of you does not mean you had luck it means you are (maybe) the better wet weather driver and better generally in critical conditions. So including that measurement would have to subjectively differentiate between an opportune podium of Stroll in Baku from an amazing wet weather drive where many drivers DNFed.
@Andrija – a driver would not be punished for driving in a weaker field if other drivers spun off since that was their own fault. Only if the oponnents had a mechanical DNF or similar.
1. Oh, I didn’t mean it like that. It would have to be a different model using a different metric.
For example we could evaluate the competition strength for each lap
https://www.statsf1.com/en/2017/azerbaidjan/tour-par-tour.aspx
and compare the expected and achieved driver lap position given other relevant factors.
Driver race rating would then be a chosen calculation involving all the lap-ratings.
This could give Massa a good rating in Baku 2017, maybe unmask driver performances that didn’t show in final results, give justice to those whose cars gave out and introduce a lot of new data that exists but currently surves no purpose.
I’m not thinking you should do it, but was just wondering if it would be feasible.
4. I’d also love to see an article with the math behind the model, maybe showing all the calculation steps on a single driver example.
P.s. Simon is right. It’s far easier to find interesting f1 articles than it is models, especially good ones, so in case of limited time science >> journalism.
When you publish the new all time list, will it include all the races of this season?
I read you for many years now and I wish to thank you for that great work !
Thankyou for the info and all the hard work that goes with trying to improve a model. I’m eagerly awaiting your next posts!
[…] measured up against his contemporaries. I will use this case to give a preview of outputs from the newly upgraded f1metrics model, which I’m currently using to prepare an updated all-time driver ranking […]
[…] statistical model used for generating driver rankings has been described in some detail in a recent post, where I documented the latest […]
Good morning. Congratulations on your great model, I have been reading it for a long time to understand its details as much as possible.
I would like to know if there is information available on the Internet on the lap times for every driver during a whole race. I suppose that, except for the modern era, there is no remaining data, but it would be great to have it, as it would allow us to develop a more precise(and complex!!) model.
Thank you very much.
[…] f1metrics model to generate objective driver rankings for 2019. I note that the model was recently significantly updated to generate more robust rankings, and was used to generate the f1metrics top 100. This is the first […]
Awaiting for your “long-overdue update of the 2014 all-time driver rankings” with the updated model.