With the wraps off the new halo-adorned cars, we launch into 2018. There are several major sources of intrigue at the dawn of the season.
- Can Renault, with three top-budget teams now in their ranks, take the fight to the Mercedes or Ferrari works teams?
- By what margin can 2018 cars exceed the already record-breaking times of 2017?
- With many lower-budget teams inspired by the aerodynamic concepts of the SF70H, how will the midfield reshuffle?
- Can Honda regain some face now that they are allied with Toro Rosso? (The results of this partnership may be inconsequential for the championship, but are vital for the future engine supply of Red Bull.)
In this article, I will first provide an analysis of the times set during testing, focusing on what can be derived from long runs. I will then provide a preview of teammate battles for the season, making predictions using my driver ranking model.
Rationale for long-run analysis
Over the last two years, I have presented analyses of long runs from testing to make forecasts for the season, which have often differed from predictions derived from the headline times. In 2016, I accurately predicted the gaps between the main competitors. In 2017, I focused on the top 3 teams (due to data availability) and accurately predicted that it would be too close to call between Ferrari and Mercedes, while most articles from respected sources were predicting an advantage (0.3-0.8 seconds) to Ferrari.
The reason I have been able to derive relatively accurate estimates is that I tend to ignore the headline times, whereas many media outlets take these times and just add correction factors for tyre compounds. Instead, I perform detailed analysis of long runs performed by the teams, not only correcting for fuel and tyres, but also investigating how much the driver is extracting from the tyres.
Long runs generally provide more insightful data for two reasons.
- First, because it’s harder for teams to disguise their true performance. On shorter runs, we have limited insights into engine modes (race vs. qualifying), how far the driver was pushing the envelope, or how much fuel the car carried. The latter factor alone can account for ~3 seconds per lap — about the difference between Mercedes and Sauber in equivalent conditions! On longer runs, the car has to maintain its performance window to generate representative data. A racing car performs as a package. Detune the engine and you affect some cornering speeds, which changes tyre temperatures, which affects degradation, etc. Perform excessive lifting and coasting and you alter brake temperatures, state of charge, tyre temperature, etc. Due to nonlinear feedback loops, it would be nontrivial to make corrections for these factors, even with access to all the data.
- Second, because we have a long train of lap-times, we can investigate the dynamics of the stint, including how the tyres are degrading.
My methods are certainly not free of uncertainties, especially since I’m working from limited information (lap times and tyre compounds only). Team-based GPS estimates are likely to be more accurate, but teams do have their own agendas when they leak data to journalists, whereas I’m looking at this as an outsider.
My primary data source this year, and in previous years, was @f1debrief on twitter, who posted many of the long runs performed by teams each day of testing. It’s not an exhaustive list of times, but it’s the best resource out there. Due to the abnormal conditions during the first test, I restricted primary analysis to days 5-8 (the second test).
Analysis method
For each stint, I recorded the driver, day of the test, and tyre compounds. I cleaned the data in two ways: (i) lap times more than 1 second slower than the lap time on either side are excluded; and (ii) the first and last lap in each stint is excluded.
For stints with sufficient valid lap times, I fit a linear regression to the valid lap times. Then, to correct for effects of fuel burn, I adjusted the slope by adding 0.054 seconds per lap (my estimate of the cost of one extra lap of fuel, which I derived in 2017 testing).
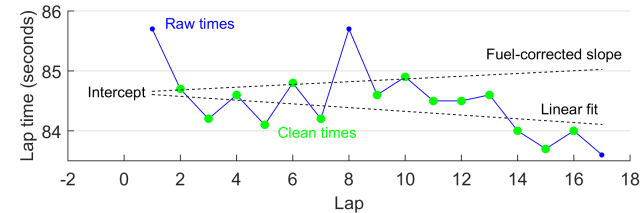
In stints with low tyre degradation, the linear fit to the cleaned data may yield a negative slope (improving times across the stint), but after fuel correction almost all competitive stints have a positive slope, reflecting performance loss from the tyres as they degrade. The value of the fuel-corrected slope is largely dependent on two factors: (i) the tyre compound (softer compounds degrade more rapidly), and (ii) how hard the driver is pushing (tyres degrade more rapidly when the driver is pushing hard).
Plotting all of the stints for all the drivers across the second test, we see the following relationship.
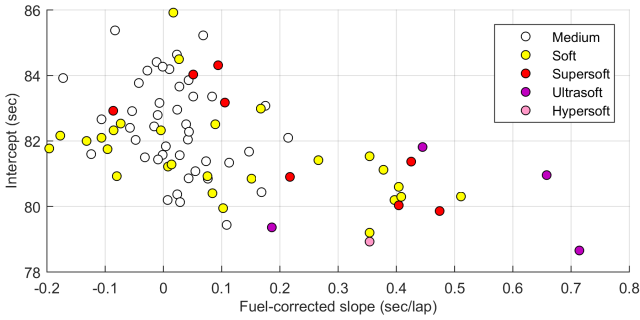
In general, stints with higher tyre degradation have lower intercepts. This is entirely expected, since a driver who is pushing harder will have lower times (at least at the beginning of the stint, before the tyres fall apart). It’s also consistent with what was found in the past two seasons.
In the above plot, we can see a significant amount of scatter. Even for points of the same color with approximately the same x-value (Fuel-corrected slope), we see a range of y-values (Intercept). This is because we are not correcting for other factors that significantly affect the intercept. These may include: differences in fuel load, differences in car performance between teams, and other factors such as engine modes, set-up, and track conditions. We therefore also need to correct the intercept to make useful inferences.
For a given team, we can create reference points using confirmed race simulations (i.e., connected stints for which the fuel load is known, since the team only changed tyres at intervening stops). For other stints, we can estimate fuel loads using the following information: (i) the car could not have less laps of fuel than the length of the stint, or more than a full tank of fuel, which generates constraints; and (ii) for teams with race simulations, we can find best fits for unknown stints to reference estimates, given plausible fuel levels at which the stint could have been run.
Using this approach, I fuel corrected all the representative long runs (throwing out stints with very few valid laps or abnormally slow times). Below is a graph showing the results for the medium compound, which was the most used compound during the test, and the backbone of most race simulations.
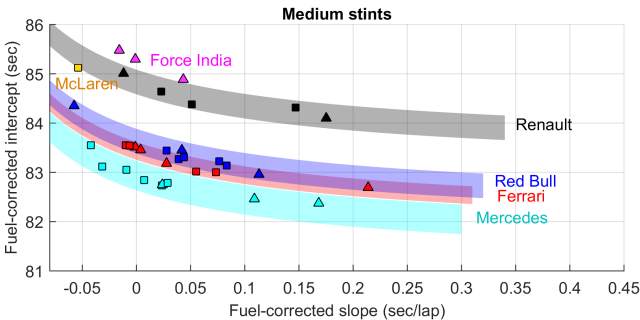
Fuel-corrected fits to stints by teams on the medium compound tyre in the second test. Squares represent stints from confirmed race simulations. Triangles are other stints.
The picture at the top of the hierarchy is clear. Only three teams came out of this test looking capable of challenging for wins (and perhaps even podiums). Of those, Mercedes is clearly the current favorite, with an estimated edge of half a second over the nearest opposition. The ordering of Ferrari and Red Bull is unclear, but a narrow edge to Ferrari emerges here on the medium compound.
A full second back from Ferrari and Red Bull, we have Renault, and perhaps McLaren, as best of the rest. Compared to other top teams, McLaren were unusual in shying away from the medium and soft compounds during testing, doing more running on the supersoft, ultrasoft, and hypersoft compounds. The one representative stint on mediums occurred during a race simulation by Vandoorne, and it would suggest McLaren have pace comparable to Renault, around 1.0-1.4 seconds slower than Ferrari.
No Force India race simulations were posted online, but I would estimate their position to be a few tenths behind Renault, based on the long runs they delivered.
The competitive position of Mercedes is determined not only from their race simulations, but also one very impressive run, shown below.
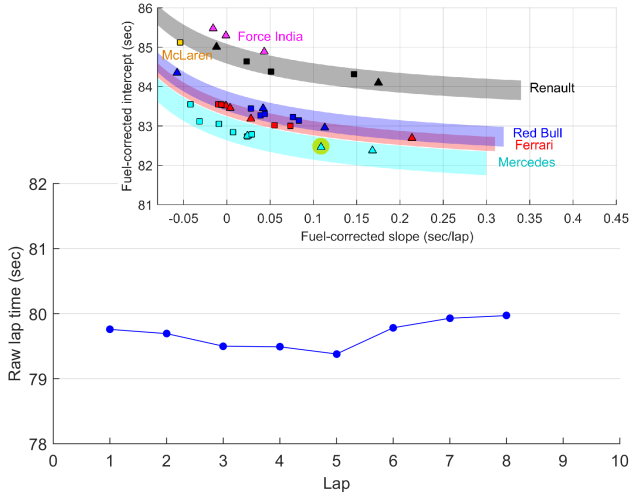
A very fast, stable stint from Bottas on the medium compound. The stint corresponds to the highlighted point in the graph above.
On day 6, Bottas unleashed an incredible 8-lap stint. Every time posted was in the 1:19s. The most conservative possible interpretation is that Bottas started this stint with only 8 laps of fuel on board. That assumption actually corresponds to the plotted position of this stint above. If Bottas had any more than 8 laps of fuel on board, the point should actually be plotted further below.
Since not all teams were well represented in the times posted for mediums, we can gain additional insights by studying long runs on softer compounds. Using my best estimates at fuel loads, the fuel-corrected stints are shown below.
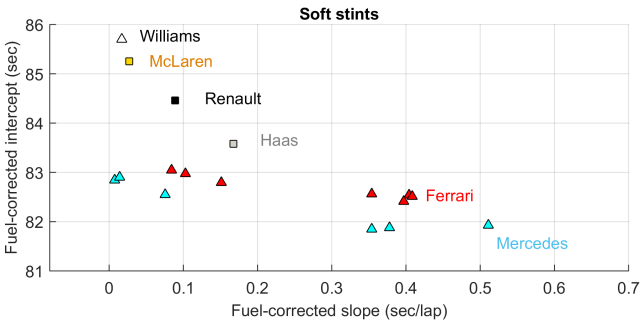
Fuel-corrected fits to stints by teams on the soft compound tyre in the second test. Squares represent stints from confirmed race simulations. Triangles are other stints.
Only three of the soft stints were from confirmed race simulations (plotted as squares), making direct comparisons more difficult than on the medium compound. Again, Mercedes have a clear edge on anyone, but only around 0.3-0.5 seconds ahead of Ferrari. This is consistent with the report that Mercedes were relatively struggling with the soft compound compared to mediums.
Renault’s placement, around 1.3 seconds behind Ferrari, is very consistent with the gap I observed on mediums. On softs, Haas looked surprisingly competitive, just over a second behind Mercedes, and probably a few tenths ahead of Renault, rendering them 4th quickest.
McLaren’s only long run on softs was during Vandoorne’s race simulation, and seemed abnormally slow compared to other McLaren stints, suggesting another factor at play, or perhaps an inaccurate fuel correction.
Williams looked quite slow on their stint with Stroll driving, around 2.5-3.0 seconds slower than Mercedes at an equivalent tyre degradation rate.
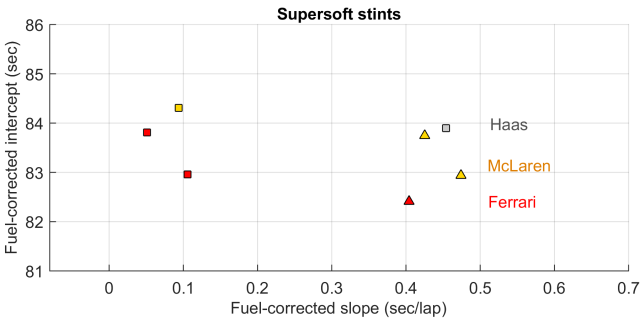
Fuel-corrected fits to stints by teams on the supersoft compound tyre in the second test. Squares represent stints from confirmed race simulations. Triangles are other stints.
Finally, a few teams ran race simulations on the supersoft tyre, usually to simulate the first race stint on heavy fuel loads. McLaren in particular favored running the supersoft compound throughout the test. On the basis of these data points, we see McLaren trailing Ferrari by around 1 second on average, consistent with the margin on the medium compound race simulations.
On the supersoft, Haas appear to be a few tenths behind McLaren. It will be interesting to see in Melbourne whether they slot in ahead or behind the McLaren/Renault cars, as these data remain open to interpretation.
Notably, I could not find any sufficiently informative stints for Toro Rosso or Sauber to establish their positions in the hierarchy. Mark Hughes’ interesting analysis suggests that Sauber are last (I don’t disagree, from the times I have seen), and that Toro Rosso-Honda have an advantage over the struggling Williams and even Force India. The main positive for Honda at this stage is reliability — something they lacked entirely over the past three preseasons.
So, what about Ferrari’s headline times? Vettel smashed the Barcelona track record with a 1:17.1 on the hypersoft compound, and Raikkonen’s 1:17.2 on the final day showed such times could be achieved with either driver at the wheel. Does this not indicate that Ferrari are now top dogs?
I don’t believe so. If we consider that Bottas achieved a 1:19.38 on mediums, and furthermore consider Pirelli’s estimated time difference of ~2.5 seconds between fresh mediums and fresh hypersofts, then this translates into an achievable time of 1:16.9 on hypersofts. The way in which Mercedes achieved this time is particularly ominous and unlike comparable times set by other teams. Bottas’ 1:19.38 was in the middle of the 8-lap stint (plotted above) where all 8 laps were within a close range (1:19.38 to 1:19.97).
Implications:
- The car was not in a one-lap qualifying mode (typically worth a few tenths).
- Nor was the car running on fumes (it could have been at least 3 laps lighter, which is worth about another 0.15 seconds)
- The tyres were not degrading rapidly, implying they could stand additional punishment
With those factors in mind, a lap time in the low 1:16s seems achievable for Mercedes on a glory run on hypersofts. Ferrari were probably still well within their car’s limits on their best hypersoft laps, but are they able to go that quick? Unless they are sandbagging in a fashion unlike any recent preseasons, the data suggest not.
In summary, looking at long runs and individual lap times, I think we can be quite confident that Mercedes have a lead on the field at this moment. Short of an upset, or a major development, Ferrari and Red Bull will be filling out the podium at most races. While I personally hoped to see the works Renault and McLaren teams entering the fray, I think the gap back to the fourth-best team remains a significant divide, at least for now. The silver lining is that Ferrari underwent a major redesign this year, while McLaren have a new engine partner and are clearly running in a compromised state with poor reliability. Both teams therefore have significant potential for rapid improvement within the season, whereas Mercedes are refining an already excellent concept.
Teammate predictions
Using my model of driver and team performance across F1 history, I made predictions of the likelihood of each driver outperforming their teammate in 2018. “Outperforming” is defined as scoring more points per counting race across the season (i.e., excluding non-driver DNFs, such as mechanical failures). The current version of the model takes age and experience effects into account, with important impacts on predictions in some match-ups, noted below.
There are no predictions for Toro Rosso, Williams, or Sauber, due to drivers for these teams having insufficient counting races to date.
Mercedes
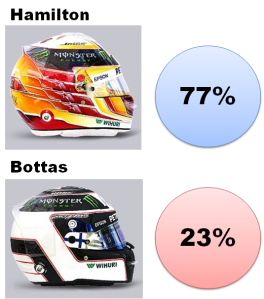
At Mercedes, Hamilton is predicted to retain the advantage over his teammate, although a 1 in 4 chance of Bottas winning can’t be totally discounted. Given the way the Mercedes car is looking after the tests, Hamilton is looking good for a fifth title.
Ferrari
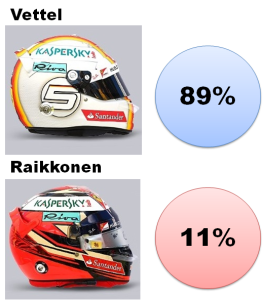
At this stage in his career, Raikkonen is clearly playing a purely supportive role to Vettel. If the Finn were to come out on top in 2018, it would be a major upset and contrary to the form guide of the past several years. In 2017, there was only one grand prix where Raikkonen genuinely outpaced his teammate. With Raikkonen turning 40 next year, that should perhaps be no major surprise. Some will wonder, how might prime Raikkonen have fared against prime Vettel? We can simulate this by correcting for both age and experience effects. In that hypothetical instance, the model gives a 74% advantage to prime Vettel over prime Raikkonen.
Red Bull
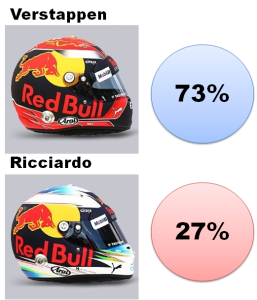 The Red Bull teammate battle is among the most intriguing on the grid. At the end of 2017, the head-to-head tally stood at 18-17 to Verstappen in qualifying, 14-13 to Ricciardo in races, and 420-359 to Ricciardo in points. Historically, it rarely gets any closer than that. Why then are the odds stacked in Verstappen’s favor here? Given his current age and experience, the model sees Verstappen still improving year on year. Will it be too much pace for Ricciardo to handle in 2018? Or will he put a dent in Verstappen’s reputation? Either way, it will be a defining year in both drivers’ careers.
Force India
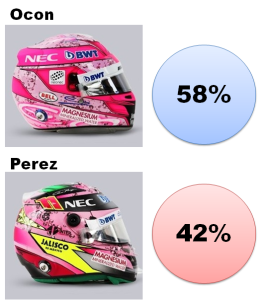
After the fireworks of last year, this should be an intense teammate battle. While Perez consistently had the edge on Ocon in the first half of 2017, Ocon seemed to have the measure of Perez in the second half of the season. Given the benefit of additional experience and age, the model sees Ocon as a narrow favorite going into 2018. Perez won’t want to let that happen, so it should be an interesting fight, even if it’s no longer for potential podium places or even points, given the number of competitors who presently look quicker than Force India’s 2018 offering.
Renault
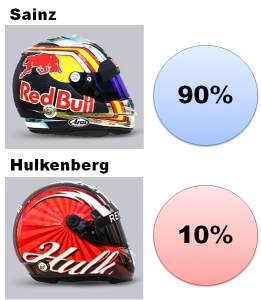
As we saw at the end of last season, the model is quite enamored of Sainz at the moment. As I explained in that analysis, this has arisen partly due to the lack of outward teammate connections from the Red Bull driver cluster. Currently, the model has limited ability to compare Sainz to drivers other than Ricciardo, Verstappen, and Kvyat. I therefore view this prediction with a healthy dose of skepticism. The Sainz-Hulkenberg match-up at Renault late last year was unfortunately quite uninformative due to Renault’s atrocious reliability. I’m eagerly looking forward to the data generated by 2018. On paper, it looks like they will be sharing track with McLaren, which could lead to some suberb battles.
Haas
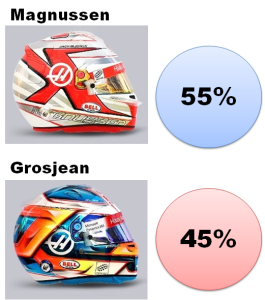
If Haas have achieved a meaningful step forward, as testing times suggest, this could be a teammate battle with increased screen time. On the basis of last year, we would expect the battle to be close. The model sees it as close to a 50-50, but interestingly with a slight edge to Magnussen. Last year, he was in only his third full season of F1, and with a career interruption in 2015, meaning he still has some scope for improvement.
McLaren
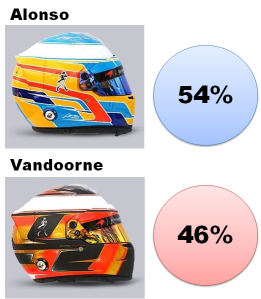 These numbers ought to raise some eyebrows. Vandoorne came into F1 with a record-breaking junior career, but was humbled in 2017 by one of the strongest drivers on the grid. By the model’s reckoning, Vandoorne’s potential for improvement, combined with Alonso’s advancing years, brings this battle into close balance. Money should still be on Alonso, but it’s no longer a clear call.
On that note, I’ll see you in Melbourne!

These analyses are the most interesting on the internetz! Even if, aside from potential Haas performance gain, no one is far from where I was expecting to see them, there should still be plenty of good team mate duels and valuable new data for driver performance model.
Great read, as per usual. 🙂 Dare I say more captivating then the competition for the championships this season? 😉
Out of curiosity what software do you use for these analyses? I thought the variation of a Bland Altman plot to visualize the teammate history of HAM in your 2017 end of season report was particularly cool.
Thank you! Matlab is my main tool for these plots and analyses.
Thanks for a well explained and detailed analysis, but unfortunately the outcome of the top 3 is similar to most of the other reports. So unless there has been some serious sandbagging and/or teams keeping their best updates hidden until Australia, we are in for a repetition of previous seasons. You estimate a difference of at least 0.5 seconds/lap right? Maybe RB can reduce that gap or even close it over the course of the season (Ferrari probably can’t), but by then the championship will already be decided.
Where is Sauber on the Teammate Predictions?
Teams with rookie drivers don’t have predictions, since the model doesn’t have any useful prior. I thought about coupling the model with my junior driver rankings to make an estimate that way. Maybe a project for another day!
Once again, great analysis.
I particularly like how you couple degradation and lap times in the intercept-slope coordinates. As I see it, given 2 cars with the same intercept, the one with the lower slope (i.e., the one in the left side of the x-axis) is doing its time with less effort from tires or even wiht less use of fuel, is it right?
Great work
I think that’s a very nice way of interpreting the relationship. Thank you!
Really good analysis, that pretty much confirms the “eye test” that Mercedes are ahead.
The percentage predictions are interesting as well – on a PPR basis (i.e. massively reducing the effects of reliability) I’d definitely take Hamilton, Vettel and Alonso at a higher percentage than the model gives them, and Sainz, Verstappen and Magnussen at lower.
Great work!
In the graphs some drivers seem to have negative tyre degradation. Is this because they start slowly and push harder at the end of the stint, or is it some measurement error?
I think in some cases it’s within error. In other cases, it may actually be drivers increasing their effort across a stint or the tyres taking a few laps to come up to temperature.
This is just impressive, a superb work!! Thanks for taking the time and effort to enlighten us all with your wisdom.
Best read of the year. I look forward to this more than the season itself. If only the gap to 4th was closer. This year i would crank the engine up and let it blow every 4th race. From the back of the grid with an engine penalty the worst a Red bull or Ferrari would do is 5th. Still plenty of points if youre winning the other races.
Interesting analysis once again, so basically we’re in for a mercedes > ferrari\red bull >> mclaren\renault > force india\haas\toro rosso > williams > sauber. Hopefully ferrari and red bull, at least the latter has a history of doing this can recover over the year, but knowing already from testing that hamilton will win is very annoying, he’s probably my 2nd favourite driver in the current grid, ahead of alonso and behind verstappen but mercedes has been too strong lately, would like to see some serious competition from ferrari, red bull or others. Probably the ferrari vs red bull and renault vs mclaren battles are gonna be more interesting than title battle.
Why do you both with your model?
When it spouts out rubbish like Hulkenberg having only a 10% chance of beating Sainz and the McLaren teamamtes being more or less 50/50, surely it’s time to give up on it?
You did read his comment about those previews, did you?? Holy….
Like in previous years very insightful analysis, clearly the best one on the web.
Thanks for that f1metrics!
BTW I still use the excel file for the analysis of practice sessions’ race pace you’ve sent me a couple of years ago. 🙂
Stunning work. Could we expect this level of analysis for practice session on a race weekend? That would be brilliant. You’re a gem amoungst the swathes of media dribbled nonsense.
Sorry I don’t trust a so-called ‘expert’ who uses senna as an avatar. It reflects a terrible lack of personnality and a mainstream media brainwash;
Well, he used to be a senna fan, hence the avatar, however he’s impartial, as shown in the rankings where senna ends up 19th, though that might slightly change with the updated version of the model, not sure.
I think that is a bit harsh, I can’t remember Mr White with Grey Background having a glittering F1 career…
Hello, first off, I really enjoy your analysis and hope you keep writing and refining. When you are correcting for tyre degradation, do you apply the same rate for all teams? Or is the rate calculated for each team? Same with the fuel burn?
Thanks
Yep, I’m assuming the same rate of fuel burn for all teams. That probably introduces a small error across stints.
The tyre degradation isn’t corrected for, but rather is one of the variables derived for each stint (i.e., the x-axis value in the summary plots).
Absolutely great analysis. Thanks for sharing as always!
Let’s see how Melbourne unleashes!
First off, there’s a couple of posts on here that belong in a kids forum, Artem and Ryan. If you have nothing to add or ask, don’t bother.
Now, this, as ever is a great piece of work and as ever raises more questions than answers, that’s all part of the prediction game eh?
My question, given that McLaren have come to the tests with half a new car, how much do you think they can close that 1.0 – 1.4 second gap to the top 3 by Melbourne? Of course, everyone else will bring upgrades but McLaren’s is supposedly substantial.
Do you think they can gain 0.5 seconds on everyone and therefore be 4th best? Is that plausible?
I think they need to sort their reliability first, since they need to finish to find some more sponsors. Or is that the opposite, i.e. they’ll prioritize qualifying laps to get some headlines to gather attention?
I’m not the author ofc, but I wouldn’t find it unreasonable for mclaren to close the gap and become 4th best, they have after all much higher budget than most of the competitors for 4th place, which include haas, force india, toro rosso, only renault has comparable budget to mclaren.
Very interresting! Thank you so much for your effort.
Great article, given you have few “haters” in the comments section speaks volumes. Will follow you going forward!
This is the first time I’ve come across your analysis – all I can say is ‘wow’. To say this is better than many so-called ‘experts’ is an understatement of the grandest order. Well done sir, well done indeed.
Hi, Mr. Philips! First time commenting here, although I’ve been a fan since its inception. I find your website to be one of the premier analyzer of the cars, since unlike others, most of your writings are irrefutable in terms they use actual maths to produce (well, except when your maths were mistaken, but I’ve never found one, unlike some other people who’re probably better at me at maths). Great article as always, and some questions, if you’ll be so kind to answer:
1. Judging from Pirelli’s press release, do you agree with the delta between the compounds? It seems to me the ultras, supers, and softs are too close together for any meaningful strategy to be at play.
2. Have you considered putting your methods to other forms of motorsport? I love endurance racing and motorcycle racing; since the testing laptimes from both series are out, can you do some analysis on both series as a project? Of course, with endurance racing, there’s that pesky BoP to consider, but I think it’d be a great read!
3. Which tracks, other than the currently-used Barcelona and Paul Ricard, do you think is best for testing F1 cars? It can be for anytime: winter testing, mid-season testing, rookie testing, or end-of-season testing.
Thank you very much, I’m glad you find this interesting reading.
1. I think that’s really difficult for me to answer at the moment, because there wasn’t much cross-over within teams on the different compounds. I would trust Pirelli’s estimates, since they have open access to much more data.
2. I’m very keen to do this! It’s just a matter of finding an appropriate dataset (working on it!).
3. I think the best approach for in-season tests is the current approach of coupling testing with a grand prix, since that simplifies logistics and minimizes costs. For preseason testing, it ideally needs to be in Western Europe, so that it’s easy to rapidly and cheaply transport parts. Typical weather in winter adds some severe limitations. I think on balance Barcelona is a difficult option to beat!
I had a crack at measuring this using the @f1debrief data and Andrew’s broad methodology, and the figures I came up with were Softs being 0.9s faster than Mediums, Supersofts being 1.5s faster, Ultras 2.1s faster and Hypers 2.8. That’s close enough to the official figures even with my shoddy mathematics that Pirelli are probably being honest with their deltas.
Verstappen and Ricciardo will be neck and neck. Daniel has better racecraft and that is reflected in the points haul. Alonso will most certainly smoke VanDorne by 6/10s at least. Not sure I’d place quite the amount of faith he does in Magnussen.
Tim Draper:
I asked the author a legitimate question. His model does not work and he himself makes a lot of errors with his analysis. There is more to F1 analysis then just copying numbers down from StatsF1. The author is a fraud.
OK, if you think he’s a fraud and his model doesn’t work, why don’t you explain why and offer an alternative model?
I’d be interested to see your analysis to compare.
I think this is, as usual, an interesting and well done analysis. Sure, there are issues, mainly due to lack of data which can’t really be helped, but the author clearly thought about those and discusses their impact. Well worth a read, certainly compared to some other rankings around.
Given that people like Mark Hughes have analysed/speculated that Mercedes might have less fuel saving than Ferrari, with Red Bull in the middle, that might mean that it is indeed a Mercedes rout to start with; but Red Bull might be close enough to battle back. Also, I hope that the Renault has run a bit low on power, with that, the gap to the top could also decrease a bit.
A question @f1metrics, have you ever re-analysed the previous years testing with data accumulated during a season, to check how far off your predictions could improve with that extra data? (of course, development during season might make that difficult, and it could be a lot of extra work too, but, I’d be interested in reading the outcome one way or the other! Perhaps only using the Barcelona race-weekend data to limit variables?).
Thanks for the interesting post.
Thank you! I haven’t synthesized in-season with testing data in that manner, but in last year’s post I did compare my 2016 predictions of inter-team time gaps to the actual time gaps in the first few races.
Oh, right, I recall reading that now! Very extensive bit of work behind that post too, by the looks of it.
Interesting that the top of the field seems to have been more accurate (more data/less incentive and room to flatter to deceive and such?) than the back. Looking at that might give hope for Red Bull, but seems to underwrite that Ferrari likely aren’t where they’d want to be.
Outstanding work again! Do you realize that each time you post your findings and explain them like you do you raise the benchmark? Nobody on the internet has gotten anywhere near you in terms of scientific analysis. You’re getting us used to demanding and expecting more!!! This is getting addicting. Keep it up please.
Great analysis with a lot of thought and creative thinking put into! Thank you, again.
I concur with the comment of Miguel Rayón. To look at the data via the plots in the Fuel-corrected slope–Fuel-corrected intercept coordinate system is a brilliant idea. You get convex curves which lend themselves to comparison. The fact that the curves don’t intersect (except perhaps for Ferrari and Red Bull) makes your statements that much stronger. (I’ve just checked: you had already used this in the 2017 preseason analysis.)
This trade-off structure is somewhat similar to (an upside-down) efficient frontier in modern portfolio theory (https://en.wikipedia.org/wiki/Efficient_frontier) where the relationship between standard deviation (risk) and expected return is plotted.
Your Achilles heel is the data source; you’d deserve much better data. Where do @f1debrief get their data from? How reliable is it? How come it’s some Greek folks having the best data? Who are they anyway: are they a radio station?! How many errors do you make when you type numbers from their posted images into some data file? I feel so sorry for you!
Wow. Very interesting read and very scientific approach – I beleive every word.
Please make a driver analysis answering the following:
Which drivers would be the favorit (against the rest) to win the Championship, if they drove the Mercedes?
How many WDC-points will you estimate Hamilton get compared to Marcus Ericsson if he drove the Sauber?
And so on.
You can do it 😉
Interesting read. Of course, there will always be the odd denier of statistics, but don’t let that discourage you – as I’m sure it won’t.
[…] F1 Metrics is Mercedes nog altijd het te kloppen team. Hoewel de grijze bolides meer dan een seconde moesten […]
Not sure if this ‘alternative’ analyses has crossed your radar yet….. https://fivethirtyeight.com/features/formula-one-racing/
Any thoughts?
Probably the worst analysis piece I have ever seen published on fivethirtyeight. Which is a shame, as I generally really enjoy the site.
“Driver and car are considered to be inseparable from Elo’s point of view. ”
That’s just silly. If they wanted something simple, they could’ve done elo teammate comparison. It produces far more likely results than these.
[…] start by recalling the state of play at the end of pre-season testing. As in previous seasons, I delved into the long runs of testing to try to determine the running order before Melbourne. Since I made predictions, it’s only […]
Will there be a 2019 pre-season analysis, and if so, when can we expect it?
Very much looking forward to it as well..
Yes indeed, it’s just up now! Apologies for the wait.
No apology necessary, am very grateful that you share this analysis. Thank you once again!
I second that motion!
[…] for predicting the within-in season pecking order. You can find this method described in detail is last year’s preseason analysis post. To briefly summarize the […]
Post of the preseason every writer in the world included.
Thanks.